(Week 11, 1998)
13-Mar-98 UT
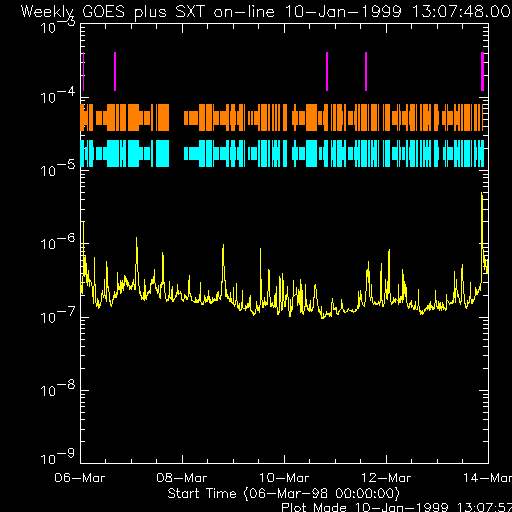
The SXT instrument continued to operate without problems, but some data were lost over the weekend due to ground-station problems. See the weekly operations report for details. The GOES time series for the current week (updates automatically) is shown below. Note the extremely rapid growth of high activity associated with AR 8179, the subject of a Bearalert.
In the display above, and you can click to enlarge it, the colored lines show the times of SXT images that currently are on line at ISAS. Long lines are high telemetry rate, normally high resolution; short lines are medium telemetry rate. The purple lines show where Yohkoh entered flare mode. This sometimes (often?) does not happen when it should, especially if Yohkoh happens to be in orbit night! The scale is too compressed here to be able to see individual data, but the times of the individual images are actually being shown. Most of the gaps will be filled in when the NASA telemetry arrives. The yellow line shows the GOES low channel flux. Since this is an expert audience, it can figure out the A, B, C, M, X levels without further help!
The images below show an interesting interconnecting loop system, pointed out by J. Gurman, in both SOHO EIT 195 A and SXT AlMg images. These loops interconnect two active regions in the S, of which one is currently extremely active indeed (see the GOES plot above if you are reading this contemporaneously).
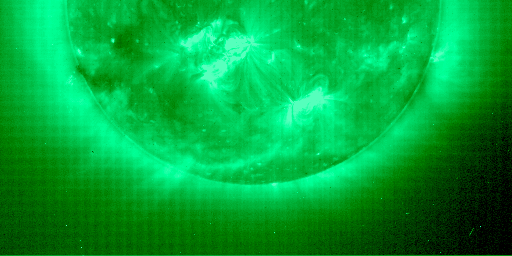
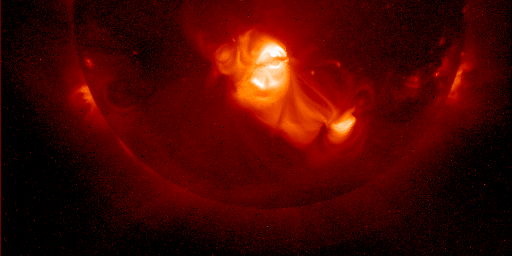
The EIT image (in FeXII; upper panel), beautifully shows almost linear features linking AR 8179 with 8175 (at S40, an extremely high-latitude region; see the earlier comment about the even higher-latitude region currently in the north. The color table has been adjusted slightly from the normal EIT choice to show the interconnections a little better. The SXT image (AlMg; lower panel) shows similar but not identical structures - these are at higher temperature. The image is half a day later, so there may have been some evolution.
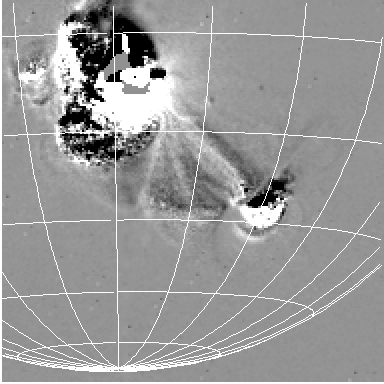
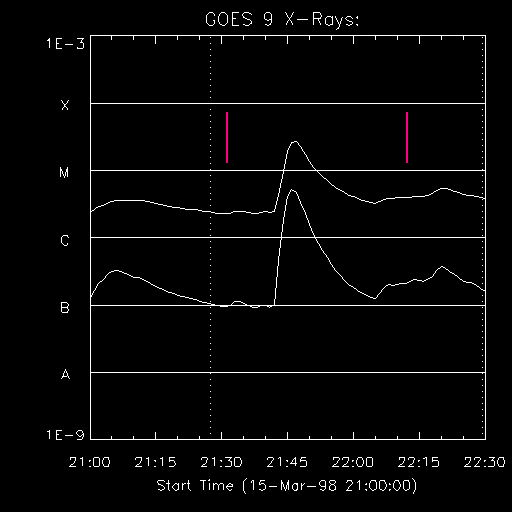
The image below (left) shows a difference of two SFD (standard composite) images, with correction for solar rotation and data compression, between 22:12:20 UT (positive) and 21:31:12 UT (negative), i.e. things that brightened up between before and after the M-class flare shown in respect to the GOES plot on the right. The important thing to notice is the mixed bag of black and white interconnecting loops; the active regions show much stronger effects because they are flaring, but the color table has been adjusted to show the fainter interconnecting loops better. Again: the pre-flare interconnections are BLACK, and the post-flare interconnections are WHITE.
|
|
We often ask "how does the large-scale corona react to the colossal energy release of a major flare?" - here we may have a partial answer. The structure has not changed in a global sense, since the connecting loops are still there after the flare. But... they are DIFFERENT loops! This is surprising, given the short time scale of the comparison (43 minutes), since the loops could probably not cool radiatively from such a large spatial scale in that time. Instead, this suggests that the current system connecting the active regions has changed in some subtle manner, involving both physical motions and presumably the heating process. The "best" global helicity of an active region noted by Pevtsov et al., found by Canfield et al. (Proc. Yohkoh conference at Bath, 1996) to be related to active-region interconnections, may indeed be involved with the energy stored magnetically and available for flares.
But.... beware of DISSENTING OPINIONS!
For those of you who have tuned in just to see the beautiful Yohkoh eclipse movies, please check here. Data from all three of the episodes have now been received from the NASA groundstations and reduced.