(Week 13, 1998)
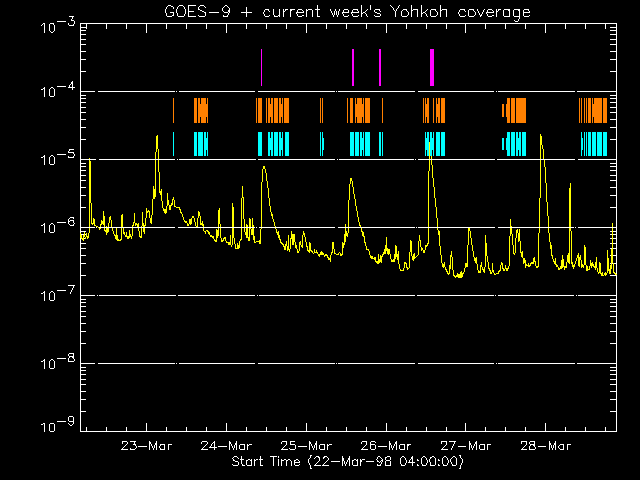
The SXT instrument continued to operate without problems. See the weekly operations report for details. The GOES time series for the week:

In the display above (click to enlarge), the colored lines show the times of SXT images that currently are on-line at ISAS. The purple lines are flare mode. The gaps will be considerably reduced when the NASA telemetry arrives and gets reformatted. For a summary index listing of the weekly science reports, click here.
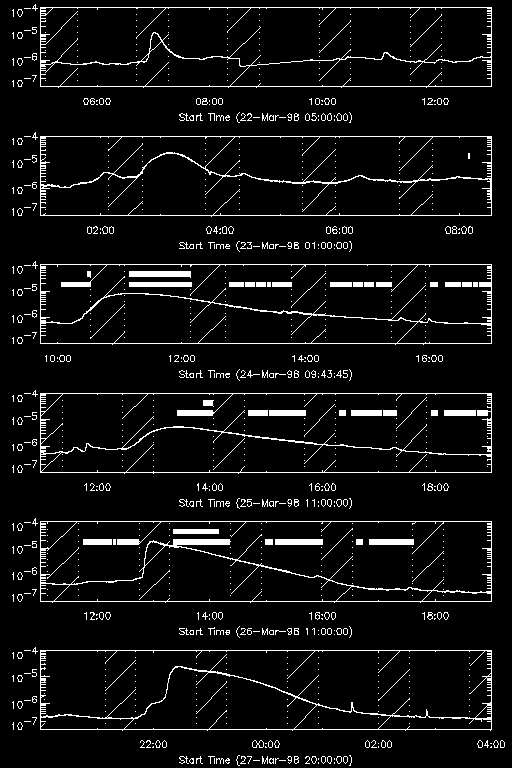
During 22-27 March 1998, there was one flare a day that was more intense than C5. At first sight, the above GOES plot suggests that these flares were well covered by Yohkoh. Unfortunately, it was not the case, as one can see in the light curves expanded for the individual flares. The hatched areas show spaceraft night. Four flares were more or less during night. Data for other two (on 23/27 March) belong to NASA downlink and have not not arrived yet. The expanded GOES time profiles are shown below (click to enlarge).

Here, we may notice different temporal variations from different regions the flares occurred. The GOES report tells us that the flare on 22 March was from AR 8185. The light curve is characterized by fast rise and fast decay. The one on 26 March (second from bottom) also has fast rise, and SXT data tell us that this one came again from AR 8185. The flare on 26 March does not give an impression that it is dynamic. Only eruptive feature was seen well into the decay. In contrast, the flares on 24 and 25 March have more gradual rise, and SXT data show that these were from the region complex (8179/8180) on the southwest limb. As shown below the event on 24 March had the classical cusp geometry. The one on 25 March did not show this, however. I think this was because the region was already well behind the limb. Anyway, like the famous AR 7260, one active region could produce an LDE type event during its lifetime in addition to confined flares that are dominant. But the flares during this week suggest that their regions affect their characeristics. I would vote that the flare on 23 March (second from top) was from the southwest region and that the one on 27 March was from AR 8185, on the basis of their slow and fast variations in the rising phase.
Although we did not observe the flare of 24 March in the steepest part in the rising phase (generally correlated with the impulsive phase), Yohkoh coverage of this flare was quite good. A movie is given here.
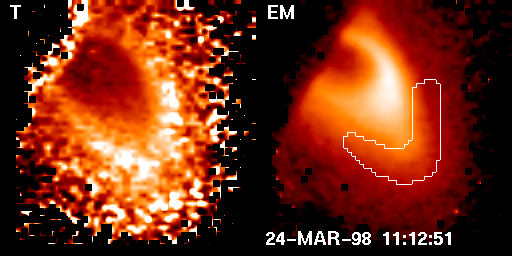
The figure below shows temperature (left) and emission measure (right) from the ratio of images in AlMg and Be filters. The scale is (4-12) MK and (10^44-10^47) cm^(-3), respectively. The temperature map is noisy as is often the case, but I tried to encircle an area that seems to have higher temperatures than the rest of the flare region. The hot area is overplotted on the EM map. This shows higher temperature at the cust region.

During this week, we also notice some spectaculart shown on the southwest limb, given by region complex 8179/8180 (possibly more regions combined). It seems to be still active behind the limb, causing, for example, eruptions on 28 March. See the following movie.