(Week 15, 1998)
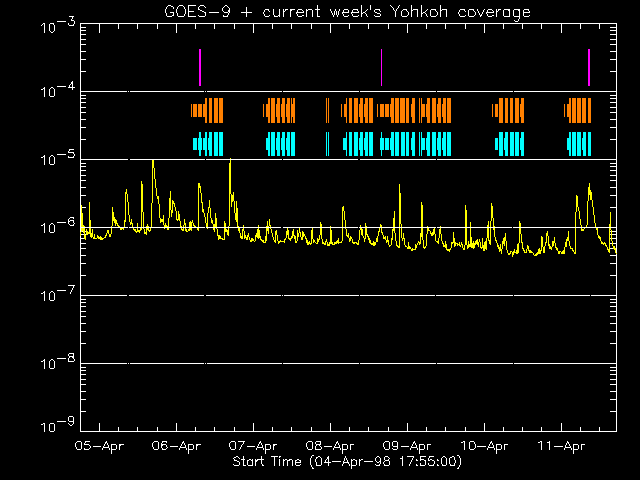
We had normal operations until an error, possibly SEU induced, occurred at the last commandable contact of the week. As a result of this error, images are not taken over the weekend. An error recovery will be performed at the first contact on Monday (13-Apr-98 04:26 UT). See the weekly operations report for details. There were many C-class and one or two M-class flares. The GOES time series for the week:

In the display above (click to enlarge), the colored lines show the times of SXT images that currently are on-line at ISAS. The purple lines are flare mode. The gaps will be considerably reduced when the NASA telemetry arrives and gets reformatted. For a summary index listing of the weekly science reports, click here.
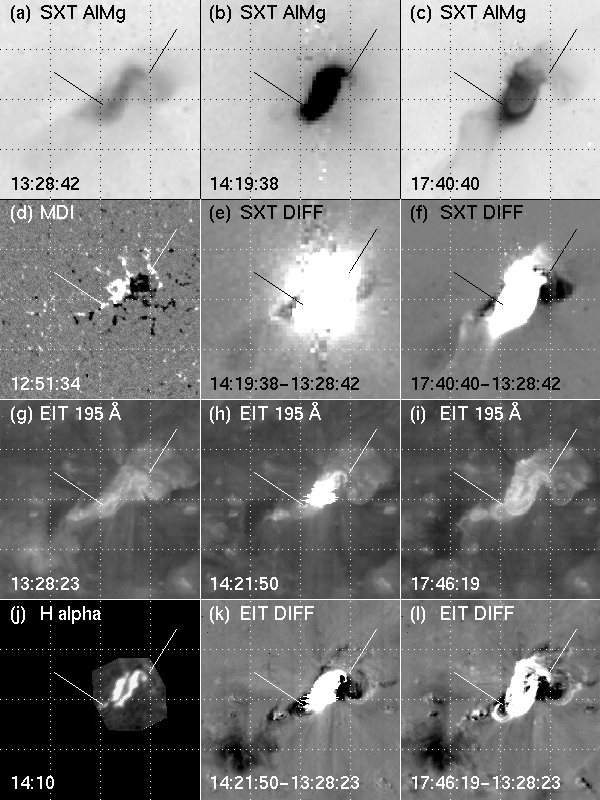
This week, we had a very successful SoHO-Yohkoh Workshop at ISAS. The topic was magnetic connectivity. This includes quiescent filaments as well as flares and CMEs. Before the CDAW, several events had been analyzed separately by SoHO and Yohkoh communities, resulting in some papers. At the workshop, however, joint analysis provided many new insights. One of them was on the major CME on 7-Apr-97. This event was clearly flare assoociated. The change in the appearance from a S-shape to cusp structure (on SXT images) made this event a nice target of the workshop.
After careful coalignment of the images using SolarSoft, several conclusions may be drawn. Click the figure below. (1) This event is a typical two-robbon flare (compare (d) and (j)). (2) The ribbons are located on either side of the sigmoid (S-shape structure) in the pre-flare SXT image ((a) and (j)). (3) The sigmoid corresponds to many loops in the simultaneous EIT image ((a) and (g)), which also shows a filament, suggesting that the sigmoid is nothing but the top of an arcade (not a single flux rope), which must be hot so that it is bright in SXT images. (4) The dimming is much more easily seen in the EIT data than in the SXT data, which are dominated by X-ray loops ((e), (f), (k) and (l)). We are in a stage where we can much better characterize this event.

If you would like to see this page in another language,
try AltaVista's Translation Service at http://babelfish.altavista.digital.com.