(Week 17, 1998)
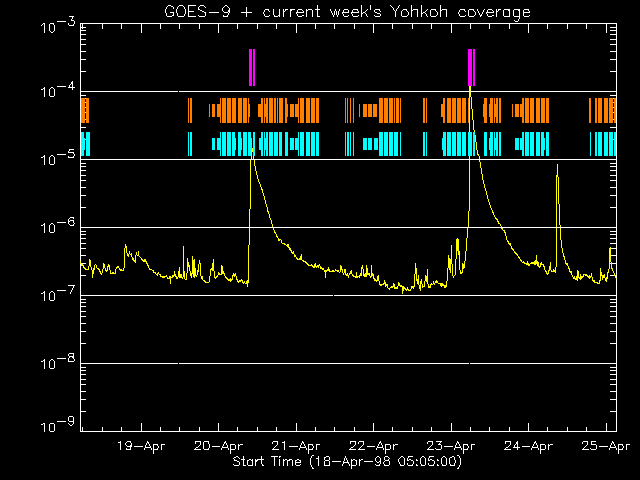
See weekly operations report for details (not frozen; this page shows the current week's information). The GOES time series for the week of this "nugget" is shown below.

In the display above (click to enlarge), the colored lines show the times of SXT images that currently are on-line at ISAS. The purple lines are flare mode. The gaps will be considerably reduced when the NASA telemetry arrives and gets reformatted. For a summary index listing of the weekly science reports, click here.

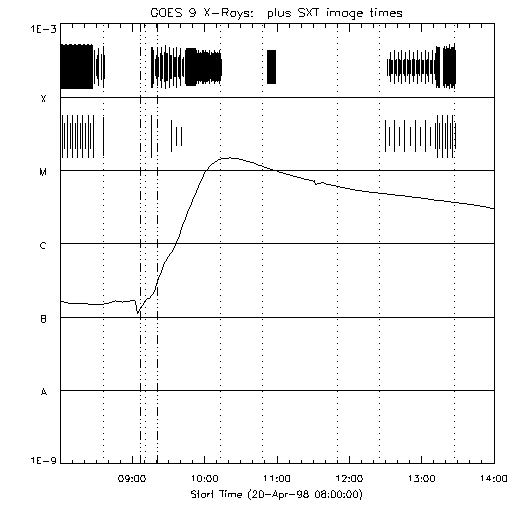
This plot shows the SXT image times (tick marks) superposed on the GOES light curve. The dotted lines show day/night. At flare-mode onset, the FFI ticks (lower) stop. We were unusually lucky here in that the rise phase, and also the pre-flare region, were well observed.
The pre-flare movie shows the beginning of the ejection, which (as shown in the GOES plot below) matches the initial rise of soft X-ray flux quite well. The movie is not quite perfect, sorry to say, the author has little time for bells and whistles this time. At the end of the movie Yohkoh switched automatically into flare mode, which happens at about the C1 level, and and there is another movie showing the flare-mode data only. The field of view here (AlMg filter) is 10x10 arc min. This movie shows a bit better the nice example of "Ron Moore's elbows" as the field appears to open up, leaving two legs behind. It is very faint in this movie because of contrast problems, sorry! These anthropomorphic things sometimes get out of hand! We don't know yet really how these legs match up with the legs of the resulting CME, but the pattern here is quite clear: the dimming region directly above the arcade that is to form shows material blowing out. As usual, we see no evidence for inflow. Note, however, the bright ejection going diagonally to the NNE (N up, W to the right).

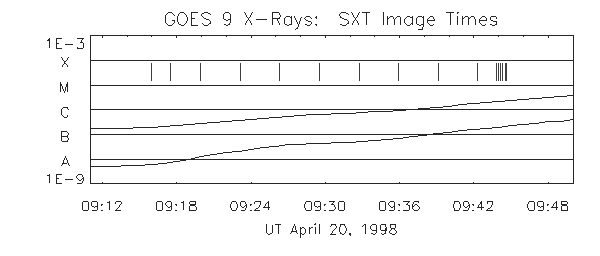
One can see the onset of flare mode in the plot above (first flare-mode image shown was taken at 09:43:51). The density of samples gets greater. We were a bit unfortunate in that Yohkoh was in medium telemetry rate, with only 1/8 the high-rate amount of telemetry, in the pre-flare state.