(Week 37, 1998)
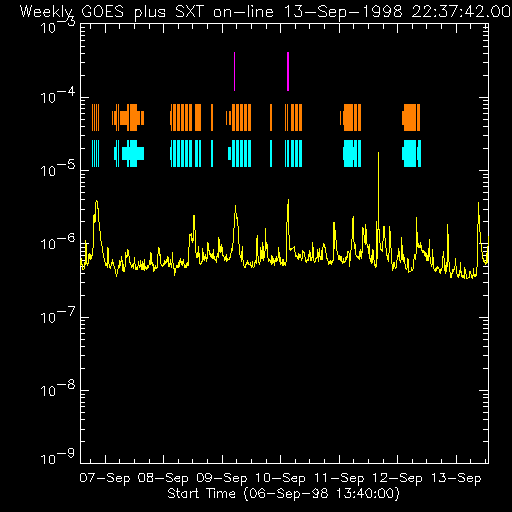
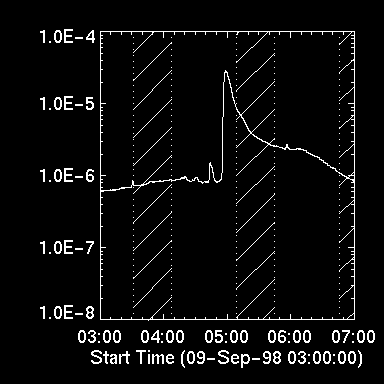
The Soft X-ray Telescope operated well as usual. During the first half of the week, we spent most of our time observing AR 8323, in coordination with the Meudon/Tenerife campaign. See the weekly operations report for details. There were two M-class flares during the week, but the GOES plot (coming from the GOES8 data) below does not show the first one (9-Sep-98 05:00 UT). Click it for enlargement.

In the display above (click to enlarge), the colored lines show the times of SXT images that currently are on-line at ISAS. The purple lines are flare mode. The gaps will be considerably reduced when the NASA telemetry arrives and gets reformatted. The following is a light curve from GOES10, showing the missing flare. SXT also missed the flare, because of a brigtening in another region. Click it for enlargement.

For a summary index listing of the weekly science reports, click here.
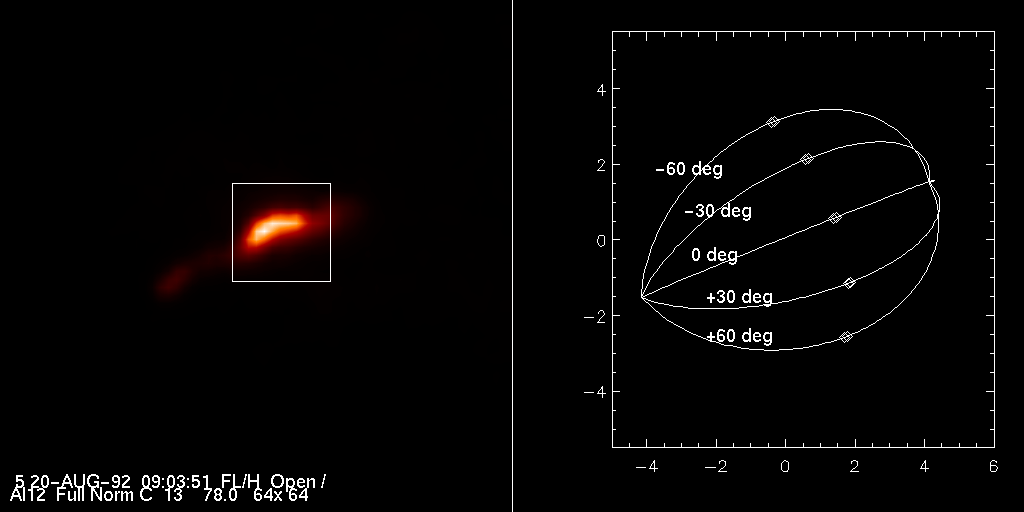
This week, I would like to think about true geometry of flare loops, remembering that the loops we see in images are always those projected on to the image plane. An attempt of restoring de-projected loops was made on the famous Hinotori flare of 13-May-81 by Loughhead, Wang and Blows (1984), although it would be difficult to determine from a single image all the parameters that define a loop. It is surprising that this kind of application has never been made, to the best of my knowledge, on Yohkoh data of flare loops. Suppose, as in the above reference, that the loop is contained in a plane and that it is part of an ellipse, i.e., x^2/a^2 + (y-c)^2/b^2 = 1. If the loop is asymmetric, it may be represented by rotating this ellipse by an angle theta. On solar surface, this structure can stand tilted to the equator by alpha and inclined to the vertical by beta. Therefore, even in the assumption of a planer loop at a given latitude and longitude, we have 6 parameters (a, b, c, theta, alpha and beta) to determine. Here, instead of trying to obtain the best set of parameters of a loop, I will show how we can restrict them. In the following figure, the left panel shows a bright loop in the boxed area. To model this loop, I used a=5.0, b=4.0, c=-0.5, theta=0 and alpha=15 deg. The last information comes from the locations of hard X-ray footpoints. The location of this flare was at N16 W26. The right panel shows how the appearance of this model loop changes with different inclination angles. The diamond signs show the loop top in each case. It appears that the loop should be inclined to north by about 30 deg. (Click on the figure to see a larger, more visible, version.)

This kind of work is important to understand how the loop is heated, even when multiple loops are involved. Note that in this event there is weaker emission going southeast from the right border of the box. The simple calculation presented here shows how the soft X-ray source would appear to move when higher loops with the same inclination and tilt brighten at later times, as assumed in the 2-D reconneciton model.