(Week 40, 1998)
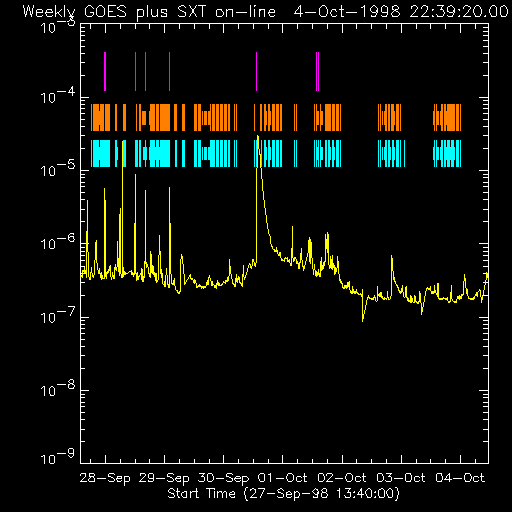
The Soft X-ray Telescope operated well as usual. The only observing campaign was a very limited bit of data in support of a Norikura/TRACE study of coronal loops. See the weekly operations report for details. There were two M flares, including an eruptive LDE (Sep. 30), this time not predicted by Pat McIntosh no doubt because it came from behind the limb.

In the display above (click to enlarge), the colored lines show the times of SXT images that currently are on-line at ISAS. The purple lines are flare mode. The gaps will be considerably reduced when the NASA telemetry arrives and gets reformatted. For a summary index listing of the weekly science reports, click here.
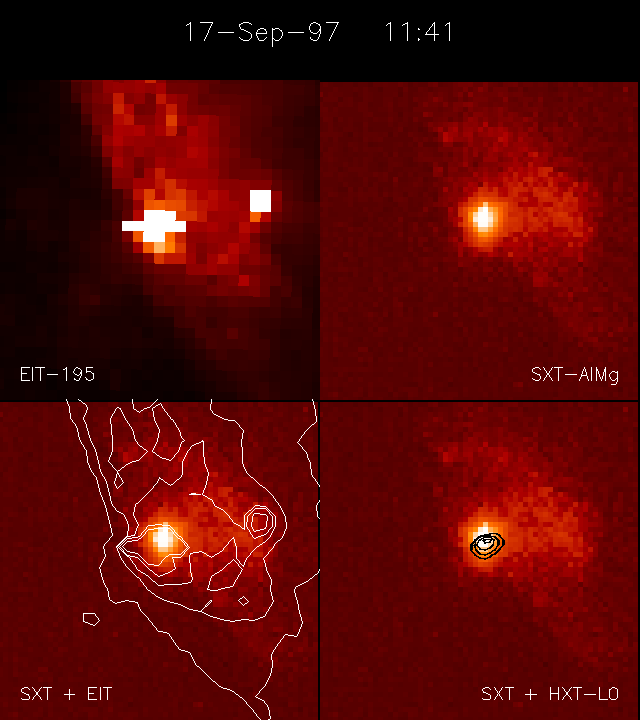
The loop-top region in a solar flare has interesting properties revealed by Yohkoh soft X-ray imaging: there is often an apparently over-pressure blob there; and a celebrated "Masuda source" with an improbably high temperature located distinctly above the SXT soft X-ray source may also occur. What do we see at lower temperatures? The EIT instrument on Soho, while not optimized for flare observations (usually with very poor cadence), can't help seeing some of them because of its whole-Sun field of view.

These images were taken during the impulsive phase of an M-class flare at the NW limb of the sun. The top left image is from SOHO-EIT and the top right from YOHKOH-SXT. The white pixels in the EIT image are saturated, but we can still derive a limit on the flux. The EIT image shows two bright sources. The source on the left is located just inside the limb at the foot of a loop system. The source on the right is located at the top of the loops.
This loop-top source is very localized and consists of relatively cool (1-2 MK) plasma. The SXT instrument with its higher temperature response shows only weak and diffuse emission at the same location. The EIT intensity contours on the SXT image in the bottom left panel further illustrate this point. The high energy (13-23 keV) HXT L-channel image shows the foot-point source only (black contours in the bottom right panel).
Most interesting are not only the compactness of this source, but its appearance during the early impulsive phase, and its low temperature compared to the "superhot" (~100 MK) loop-top sources reported by Masuda.
Oct. 2, 1998: J.-P. Wuelser (email wuelser@sag.lmsal.com) For a summary index listing of all of our weekly science reports, click here.