
(Week 27, 1999)
See the weekly operations report for details.
In the display above (click to enlarge), the colored lines show the times of SXT images that currently are on-line at ISAS. The purple lines are flare mode. The gaps will be considerably reduced when the NASA telemetry arrives and gets reformatted.
For a summary index listing of the weekly science reports, click here. Generally, these notes contain current research, or ideas related to current research in solar physics, as revealed by Yohkoh. They are done in "real time" and so they may contain (a) jargon, (b) blunders, or (c) trivialities. Of course they are not screened by referees! We are always happy when somebody writes a paper stimulated by one of these nuggets, and it happens frequently. The SXT Chief Observers (most of the authors) do not have any proprietary rights to the data or ideas presented.
 For this week's nugget we're going to explore the details of a
sigmoid. Common knowledge now suggests these are
loaded cannons,
ready to go off at a moment's notice on the unsuspecting villagers.
For this week's nugget we're going to explore the details of a
sigmoid. Common knowledge now suggests these are
loaded cannons,
ready to go off at a moment's notice on the unsuspecting villagers.
Q: Did it?
A: This time, yes!
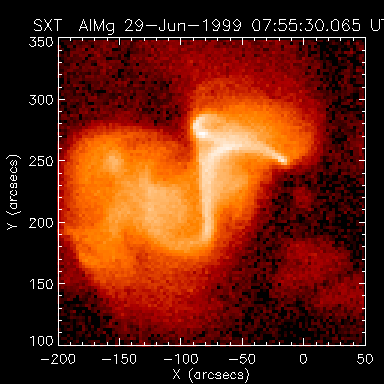
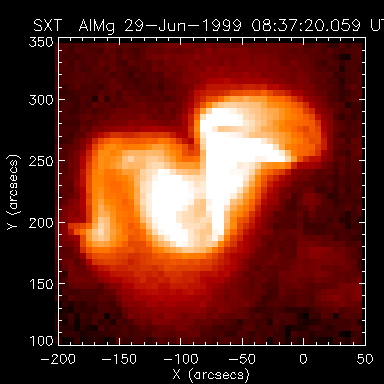
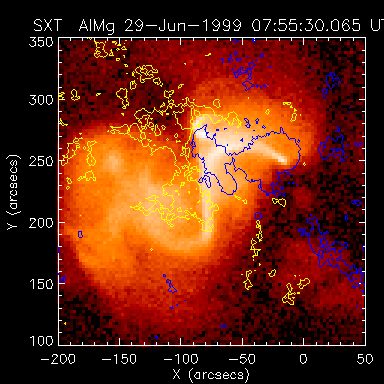
The two above images show the sigmoid, better known as NOAA Active Region #8602, shortly before the impulsive phase (e.g. spacecraft night) and then again during the decay phase. The image at left is full resolution and the image at right is half-res. The images have been cropped approximately to the TRACE field of view.
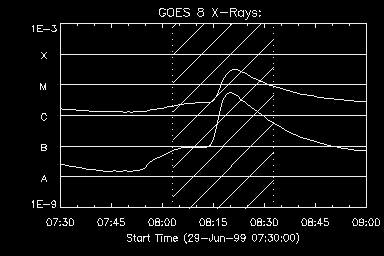 In the GOES plot, we can see (or could see, if any detail was
left in this thumbnail) the Yohkoh flare avoidance system in
proper operation -- the peak of the flare, of course, occurs during
spacecraft night. However, this doesn't prevent us from looking at the
flare shortly before dusk and shortly after dawn to see what's up.
In the GOES plot, we can see (or could see, if any detail was
left in this thumbnail) the Yohkoh flare avoidance system in
proper operation -- the peak of the flare, of course, occurs during
spacecraft night. However, this doesn't prevent us from looking at the
flare shortly before dusk and shortly after dawn to see what's up.
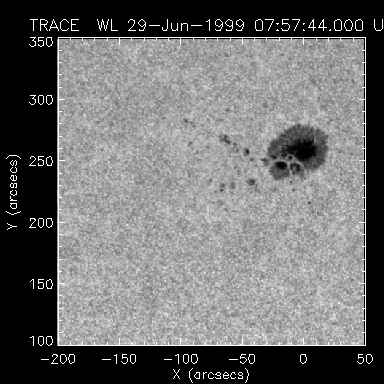
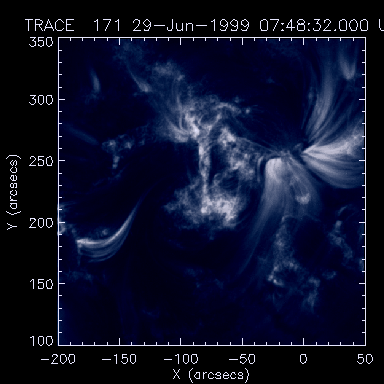
Specifically, let's see what TRACE and MDI were looking at in this same time frame. TRACE was in fact following this active region and its connections to the region to the west (to the right of these images), so the cadence is pretty slow. TRACE was able to continuously observe this region for the entire duration of the flare, but the results are underwhelming: TRACE didn't see anything.
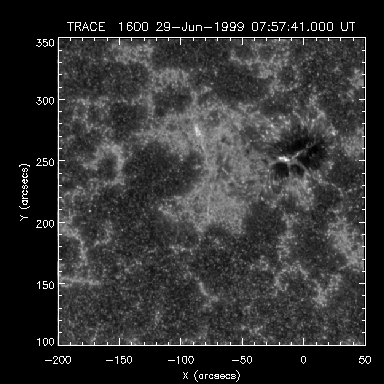
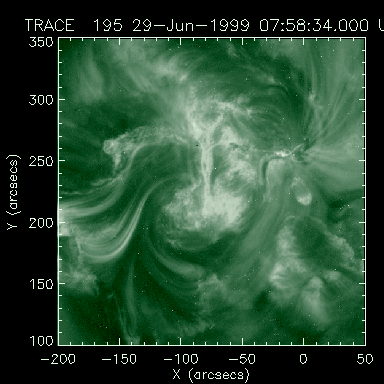
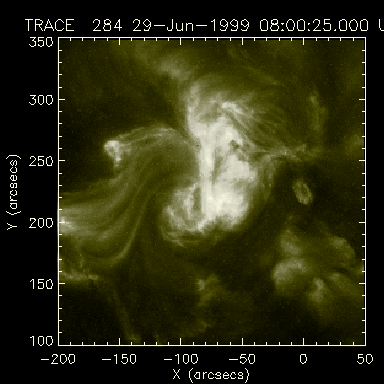
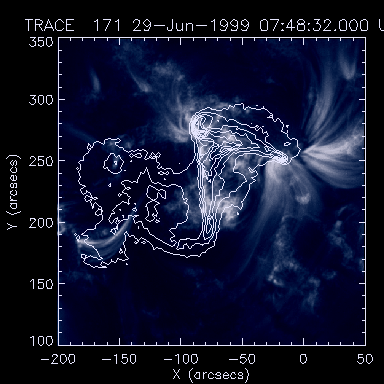
Let us not discard TRACE so quickly, however. With nominally 25 full-resolution pixels to every one in SXT, we can certainly see a lot more of nothing with TRACE than we ever could with SXT. So, on the assumption that a lot of data is better than no data at all, may we present the following TRACEdata dump on AR8602: white light, 1660 Å UV continuum, the Fe IX line at 171 Å, Fe XII at 195 Å and finally the Fe XV line at 284 Å. These images are ordered left to right in increasing temperature, from a modest 6000 Kelvin at the left to a ballpark of 2 million Kelvin at the far right.
Not to be left out is the ubiquitous measurement of the photospheric magnetic field with MDI. This measures the line-of-sight strength of the magnetic field underneath this event. Black is one polarity, white the other, and grey is somewhere in between:
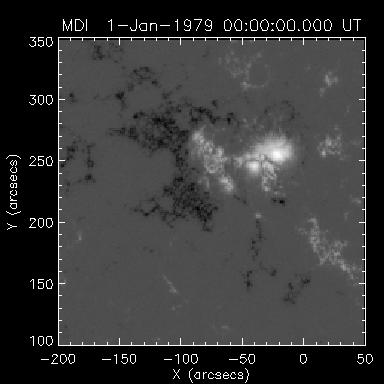
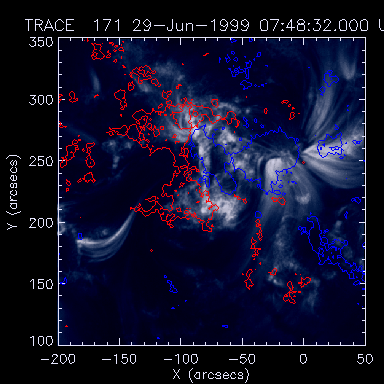
(We've fiddled with the contour color here to get them to show up against the colored backgrounds.) It's clear that the sunspot to the west (at the right of the field of view) is a main player in this active region. The bright vertical structure (running north-south in the field of view) appears to be somehow related to the location of the inversion line, the fine line drawn between the two opposing polarities. This is nothing particularly new, but is pretty obvious in this flare. In the spirit of keeping this short, we'll only have a look at one more overlay: SXT brightness contours on the TRACE Fe IX image:
For our current purposes, this isn't telling us much. It does show quite clearly that TRACE and SXT aren't generally looking at the same plasma: SXT is looking at much hotter, brighter material, while TRACE tends to look lower in the atmosphere at relatively cooler material. To really take this flare down, we'd need to spend some time looking at some movies of the various datasets. Doing this, we could look for events in one temperature/wavelenght regime, and try to find analogues in the others. A prime example might be loop footpoints in the ultraviolet and white light. When we observe a flare in SXT, what happens at the footpoints, and when? All good mateial for a later nugget.
If you would like to see this page in another language,
try AltaVista's Translation Service at
http://babelfish.altavista.digital.com.
July 2, 1999: Brian Handy
(handy@isass0.solar.isas.ac.jp)