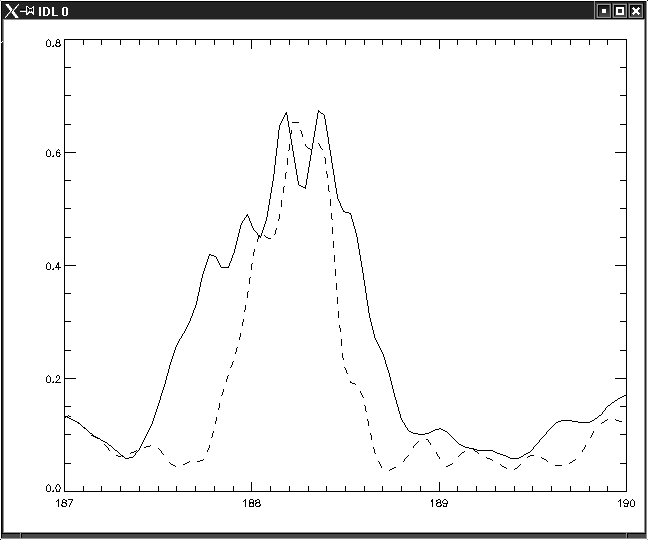
This example overplots a sub-section of GIS detector 1 from 2 different GIS observations.
Note that the wavelength calibration varies with each GSET. So, when comparing observations that have been taken with different GSETs the wavelength calibrations must be checked to ensure they have been restored.
To check what GSET and an observation was taken with type:
IDL> print, qlds2.header.GSET_ID
The example:
IDL> qlds1=readcdsfits('s8965r00') : read the data into the Quick Look Data Structure
IDL> qlds2=readcdsfits('s8966r00')
IDL> gis_smooth,qlds1 : correct for fixed patterning
IDL> gis_smooth,qlds2
IDL> print,restore_wavecal(qlds1) : restore the relevant wavelength calibration file. Prints '1' if restored.
IDL> wave1=pix2wave('GIS1',findgen(2048)) : calculates the wavelengths across GIS detector 1 for all 2048 pixels
IDL> data1=gt_windata(qlds1,0) : returns data for GIS detector 1 (window 0 is for GIS1)
IDL> print,restore_wavecal(qlds2)
IDL> wave2=pix2wave('GIS1',findgen(2048))
IDL> data2=gt_windata(qlds2,0)
IDL> plot,wave1,data1/max(data1),xrange=[187,190],linestyle=2
IDL> oplot,wave2,data2/max(data2)
The resulting plot is:
