Swift UVOT Calibration Report
Zemax optical models for the UV-Grism study:
Second order wavelength scale for sources near the
axis
Date: 2008/06/17
Version: 1.0
Prepared
by: N.P.M. Kuin (MSSL/UCL)
Relevant Documents
Zemax optical models for the UV-Grism Study: Zemax pixel
scale factor, wavelength scale, and boresight, version
1.1, Swift UVOT Calibration Report.
Introduction
This report builds on, and extends, the previous report on the
Zemax pixel scale, wavelengths scale and boresight for the nominal
filter wheel observations and first order. The same
observations of WR52 and WR86 are used, with one change: the spectra
of two observations were summed, after the removalof obvious
artifacts.
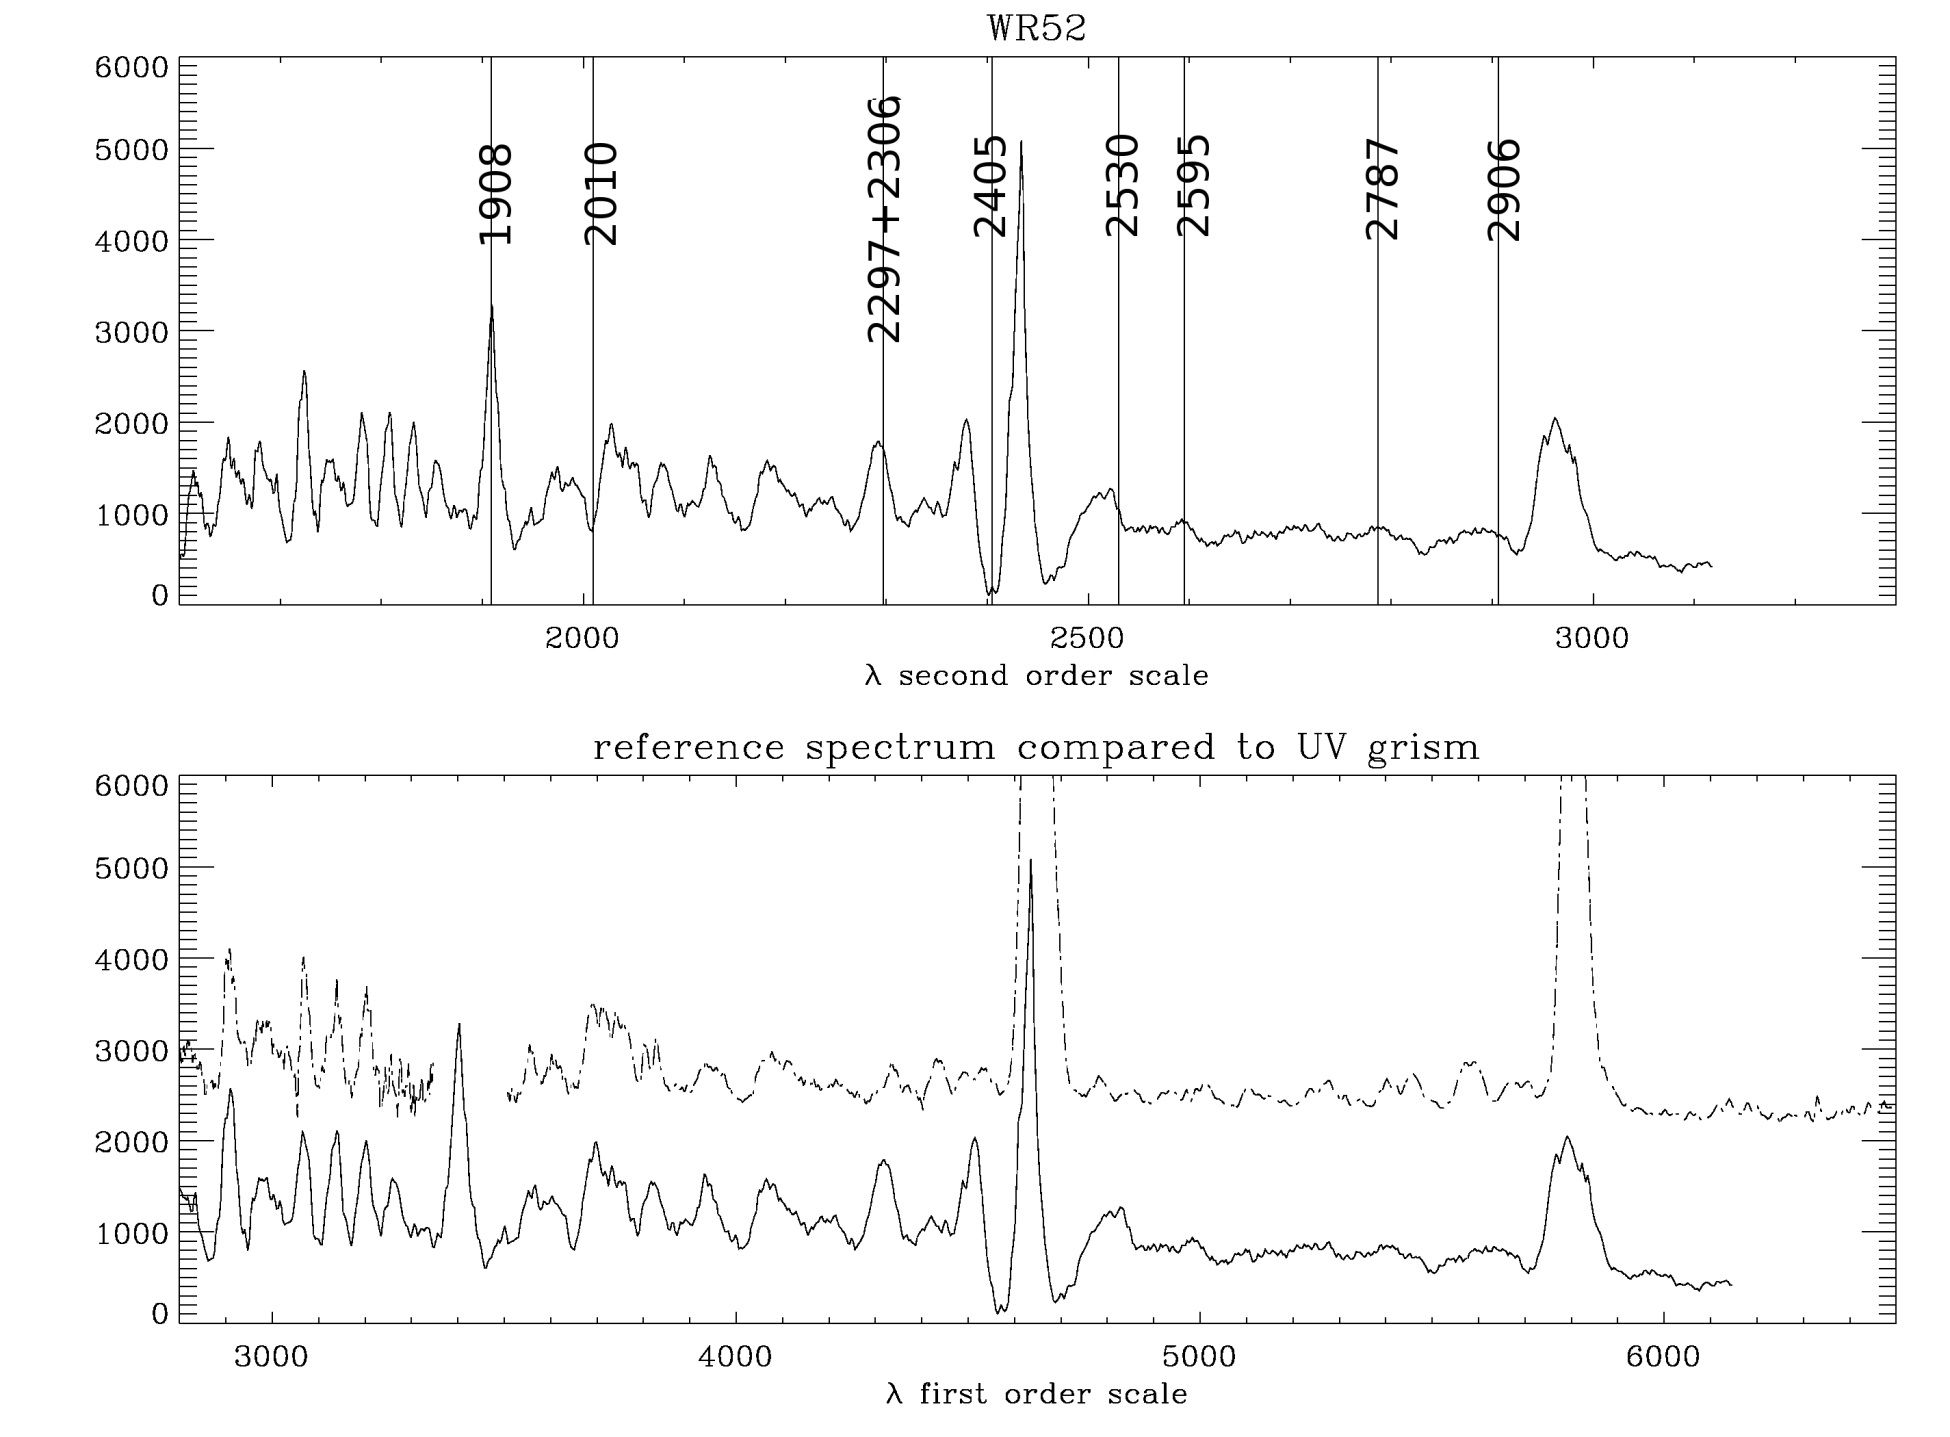
Comparison of the observed spectra to the reference spectra.
A comparison of the observed and reference spectra was made in
order to identify spectral features that were in the UVOT spectra,
but not in the reference spectra, with the aim to identify candidate
spectral lines in second order. This is made more complicated,
since the IUE spectra are not very reliable for wavelengths larger
than 3200Å, and there is a gap from ~3300-3500 Å in the
reference spectra. Also, in the uvot spectra, the strong CIII
line at 4649 Å is too bright, and coincidence loss and
centroiding eat away in the spectrum around that line, so that the
spectral region of ~4550-4770 Å is not useful for diagnosing
second order lines, since they will be lost.
In WR52 no
good, clearly ourstanding, unidentified, spectral features are
apparent, although there are possible excesses. In WR86, there are
several which are apparent. (1) There seems to be excess emission
around 3590, 3807, 3881, 4002, 4187, 4256 Å. In both spectra
there is an unidentified feature at ~3316 Å, but there is no
reference spectrum available. At ~4850 Å both spectra show a
minor excess.
The zemax second order wavelength scale
The zemax model provides second
order points, for the same model calculated for the first order.
Therefore we can use the same anchor point as before (260nm in first
order), and derive a polynomial through the calculated points.
Similar to the first order, the polynomial needs to be at least of
third order to remove systematic variations. The polynomial
is:
Table 1. The Zemax second order polynomial
fit anchored at 260nm, first order.
|
a0
|
a1
|
a2
|
a3
|
|
λ(Å) = Σ
an Dn
|
1613.8±5.95
|
1.096±0.039
|
(7.97±0.71).10-4
|
(-3.028±0.380).10-7
|
Using the wavelength scale, the features with excess
emission found in WR86 in the 3590-4002 Å range should
have corresponding features in the first order at 1987-2155 Å,
which is not seen. Taking a possible uncertainty into account of
several pixels will not change that conclusion. The features at 4187
Å and 4256 Åwere predicted by the second order wavelength
scale to be from lines at 2234 Å and 2264 Å, but both
features are about equally strong, and even if one of them is a
misplaced 2297 Å feature, there is no corresponding second,
equally strong line known to be some 30 Angstrom away.
Using strong first order lines, to seach for a signature in
second order.
Since the instrumental sensitivity cuts off below ~1700 Å
and above ~7000 Å this is the only range to be considered.
However, the second order does only extend to about 3200A on the
detector for the observations under consideration, since the
dispersion is about 1.5Å/pixel, about half that of the first
order. The observed spectra were plotted with the zemax second order
wavelength scale. This can be useful to seach for the strongest
lines expected to appear in the second order, which are the 1909,
2297, 2405, 2530, 2906, 3070 Å lines.
Unfortunately,
the 1909 Å line is predicted to form a blend with the strong
3409 Å O VI first order line, which shows asymmetry and is
quite broad, but does not provided any conclusive evidence for the
second order 1909 line. The 2297 second order line falls on top of
the 4320 line in first order in both spectra, and cannot be
identified. The 2405 Å line falls in the overexposed region
arounf the first order 4649 Å CIII line, but the 2530 Å
CIV line in second order is predicted to be present at ~4850 Å
in first order. Indeed, in both spectra there is a small feature,
which is not present in the reference spectra. The second order
2906 Å line is predicted to fall on top of the strong
5696 Å CIII line. The 3070 Å OIV second order line is
predicted to fall in first order at ~6000 Å, but no credible
spectral feature is found.
The result of this
exercise with these two spectra is thus that there is only one
possible match for the 2530 Å line, which would be
consistent with the Zemax second order wavelength scale.
Unfortunately, we will have to use other objects, which have
some strong emission lines in the 1900-3100 Å range, but have
less spectral lines at longer wavelength causing confusion.
Assuming that the small feature is due to the 2530 Å
line, and drawing a continuum, we can compare the relative strength
of the second order feature to that in the first order. I find for
WR86 that the peak value in second order is about 30% of the peak
value in first order, and in WR52 ~ 25%. One has to remember, though,
that the FWHM in second order is up to twice that in first order, so
the flux does not scale with the peak value. It is not clear
what the FWHM in second order would be, as the width of the spectral
lines is expected to be similar the the first order spectral
resultion.
Conclusion
Other spectra
It is useful to be able to use the new dispersion relation in
uvotimgrism. To that end, the distance to the anchor point from
uvotgraspcorr was first determined.
The anchor point found by
uvotgraspcorr (pre-release version), was determined for all four
spectra, and used to determine the offset to the 260nm position in
first order, which was also measured. The mean offset found is
(543,-290) with a 1-sigma error in the mean of about one pixel in x
and y. The anchor point, using the on-axis zemax solution, thus
fall on position (1520.5, 700.1), which is offset from the zemax zero
order by about 8 pixels. Projecting the position found on the zemax
zero order, the wavelength where the anchor falls is estimated to be
~575±15nm.
The pixel distance from the 260nm point in first order
to the anchor point in the zero order, is estimated to be 615.6
pixels, with some uncertainty due to the 8 pixel offset of the
derived point from the model zero order.
The dispersion relations can be derived as polynomials with
respect to the anchor point, by calculating a fit to the zemax points
starting at an interpolated position in zero order at 575nm.
The coefficients found have been put in table 2.
Table 2. the Zemax polynomial fit starting at the
zero-order anchor point from uvotgrascorr
|
order
|
|
a0
|
a1
|
a2
|
a3
|
a4
|
|
first
|
λ(Å) = Σ
an Dn
|
1620.9±60
|
-0.855±0.39
|
(6.024±0.885).10-3
|
(-3.574±0.835).10-6
|
(8.137±2.80).10-10
|
|
second
|
λ(Å) = Σ
an Dn
|
1307.7±42.3
|
0.169±0.128
|
(1.21±0.12).10-3
|
(-3.03±0.38).10-7
|
|
|
second
|
D(pix) = Σ an λn
|
-1497.8±72.1
|
1.779±0.088
|
(-4.236±0.353).10-4
|
(4.886±0.459).10-8
|
|
Using the dispersion relations, a spectrum extracted using
uvotimgrism can now be displayed in the wavelength region 1800-3000
Å, by calculating the wavelength scales for first and second
order from the Dispersion variable in the output file. The spectrum
can then be plotted with both scales, and a strong first order line
should also be visible in the second order at the same wavelengths.
The spectrum of the variable HD109962 was examined this way, but
showed no evidence of strong first order lines in second order.