
| Results for artificial test data |
|---|
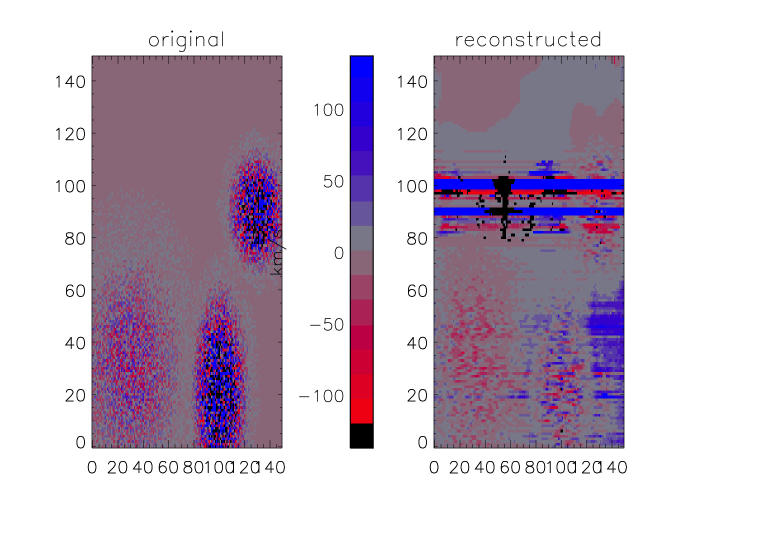
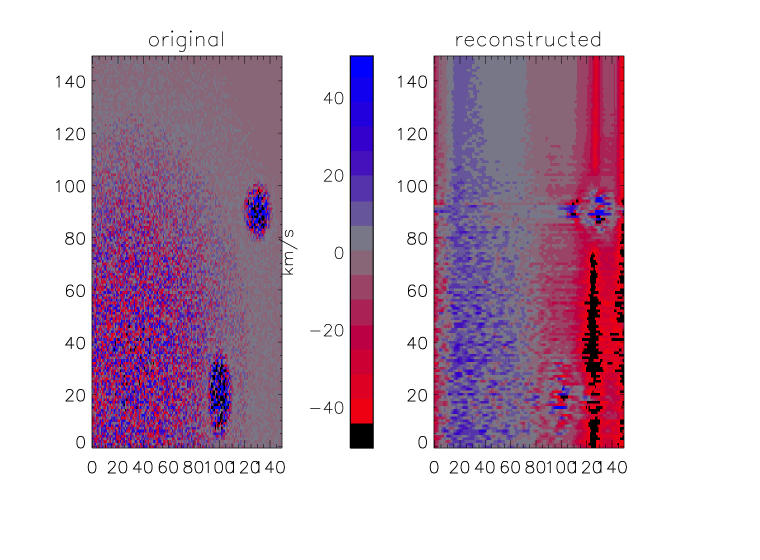
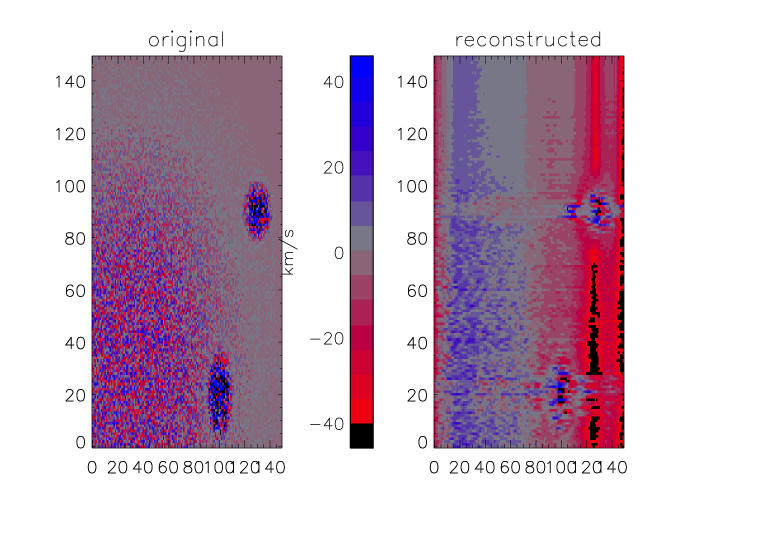
This pages summarises test results performed on artificial data sets. The artificial data is based on Chianti spectra for the respective lines (see links in table captions). Underneath each pixel in the two-dimensional images lies a superposition of Chianti spectra of the same wavelength region but for different parameters such as electron pressure, DEM, and radial velocity. Electron pressure and DEM depend on the location in the image and correspond in their values to various features like coronal holes and active regions. Radial velocities within these regions vary randomly with maximum random absolute values depending on the region. All is placed on top of a quiet sun with uniformly random radial velocities.
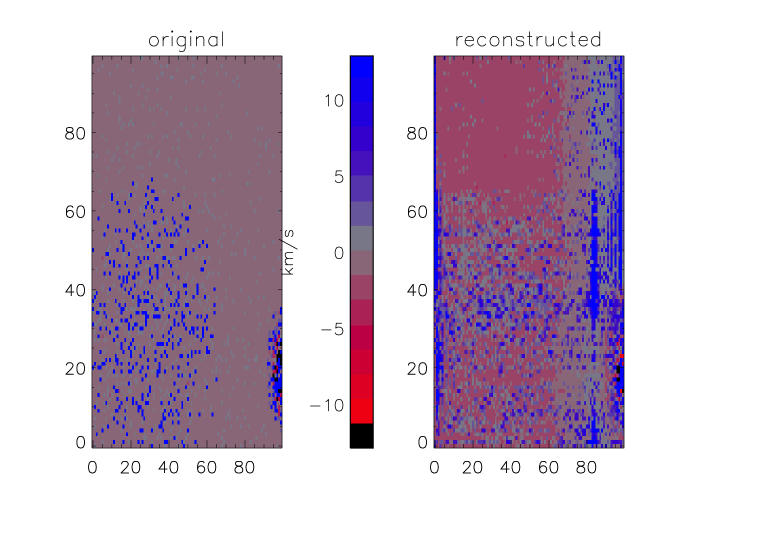
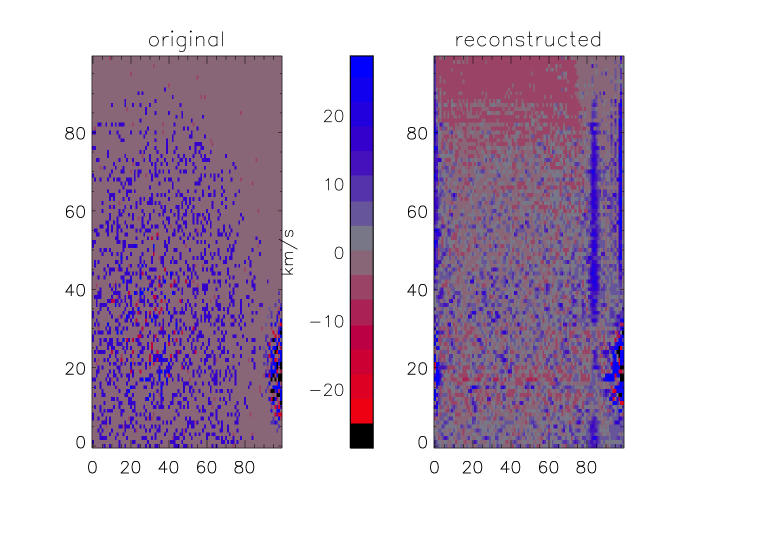
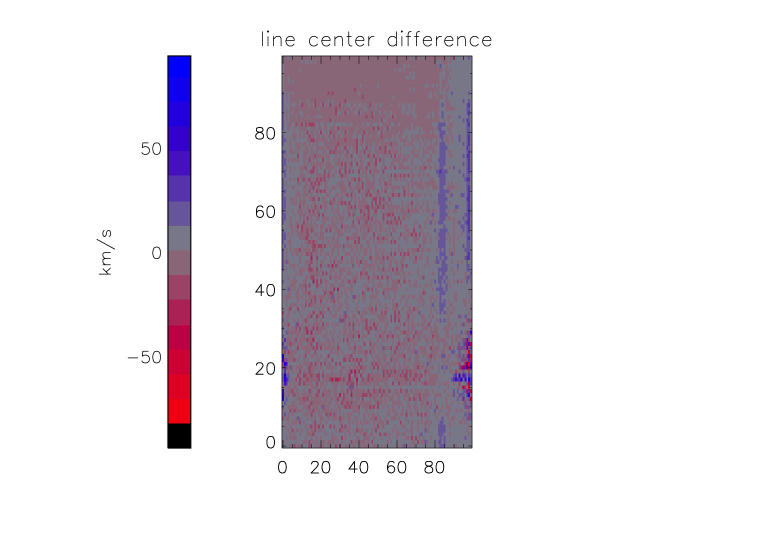
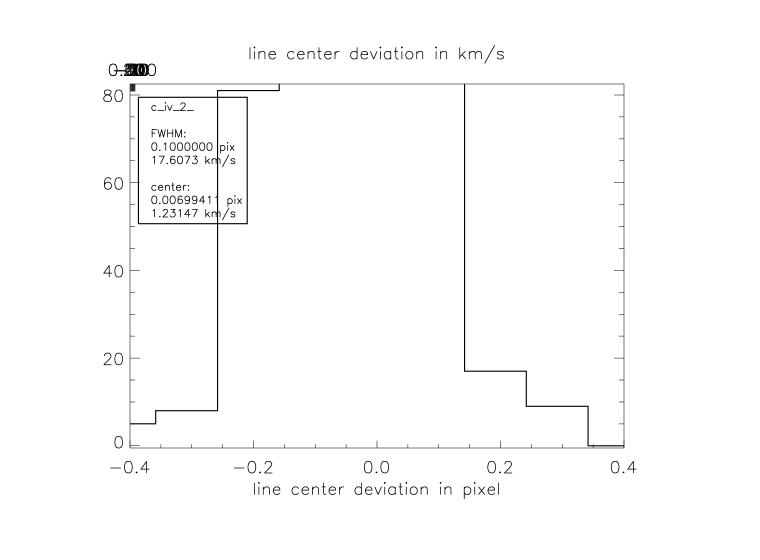
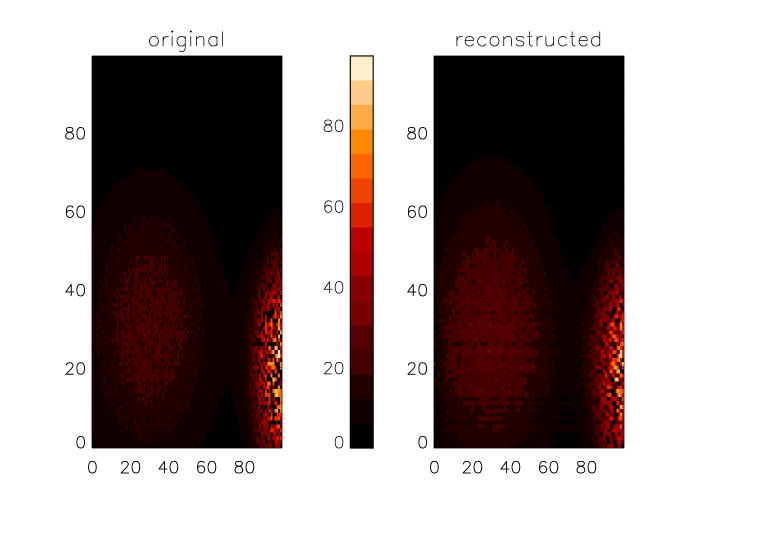
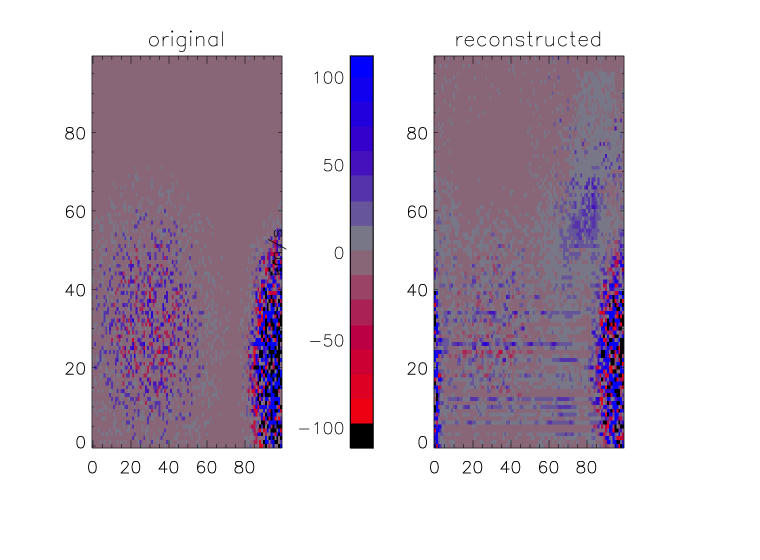
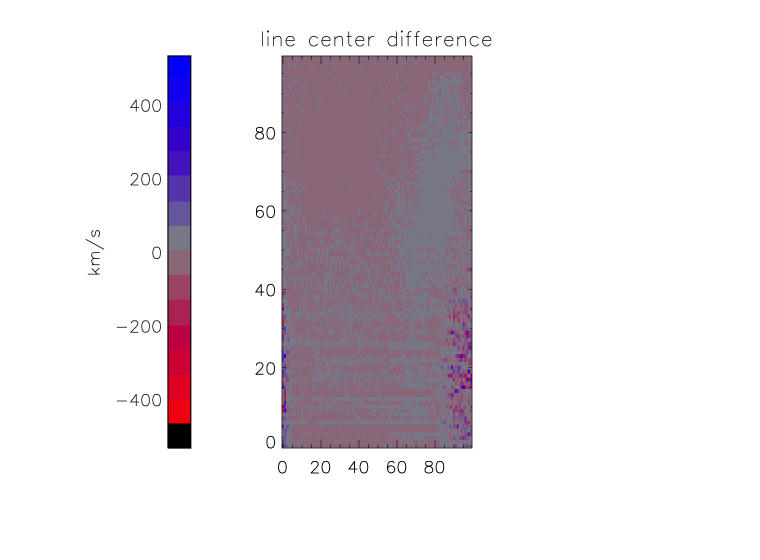
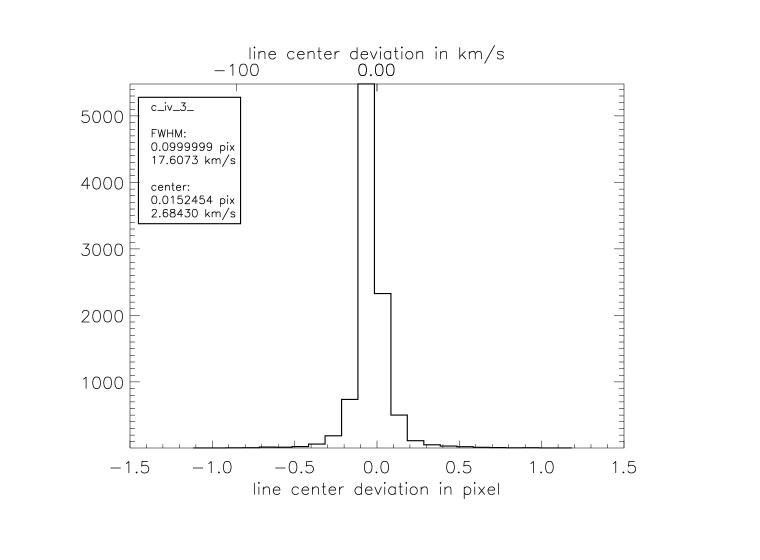
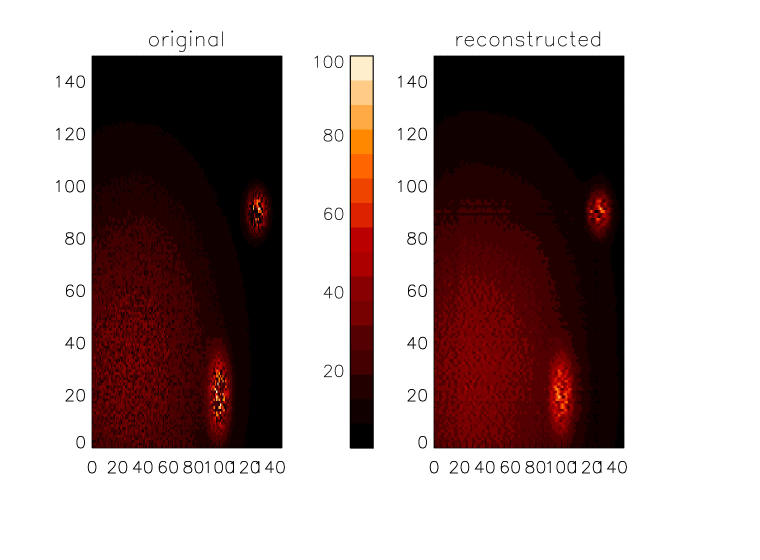
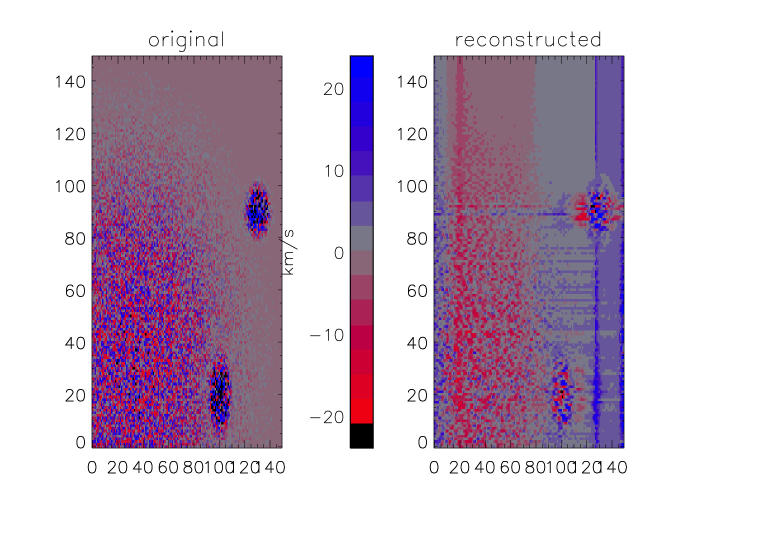
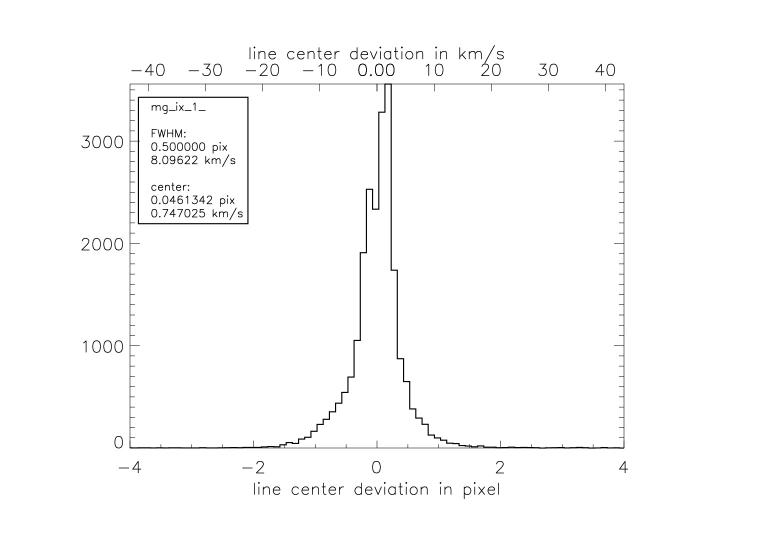
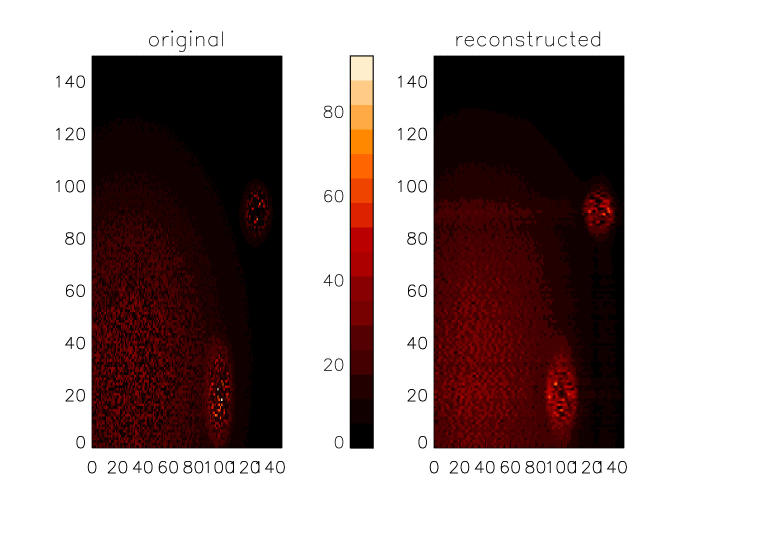
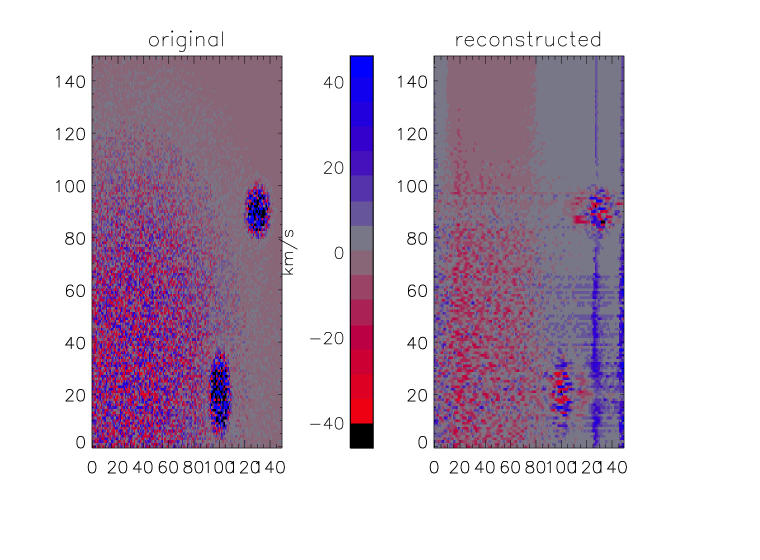
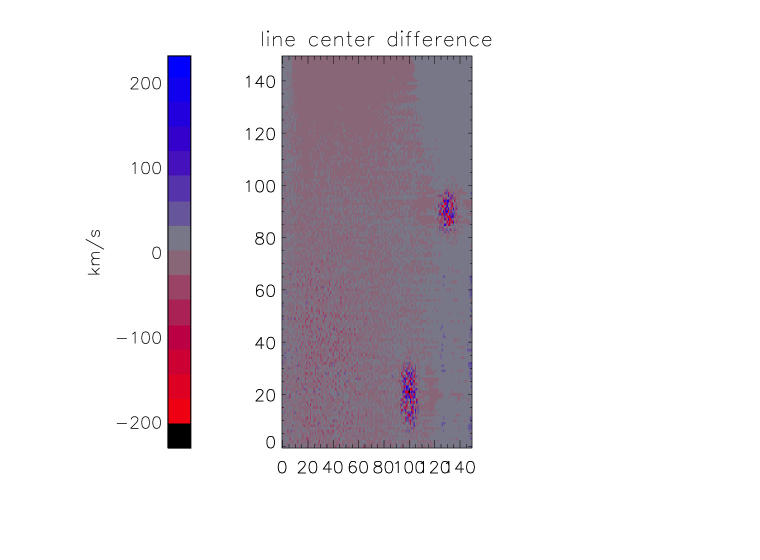
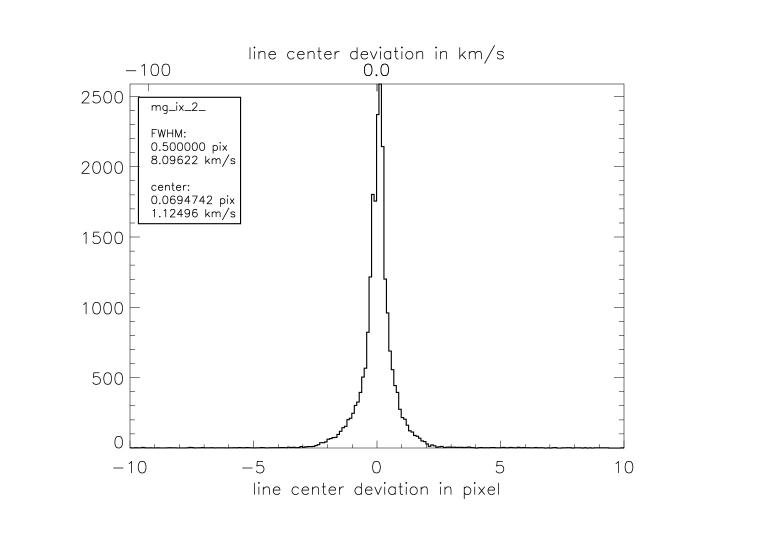
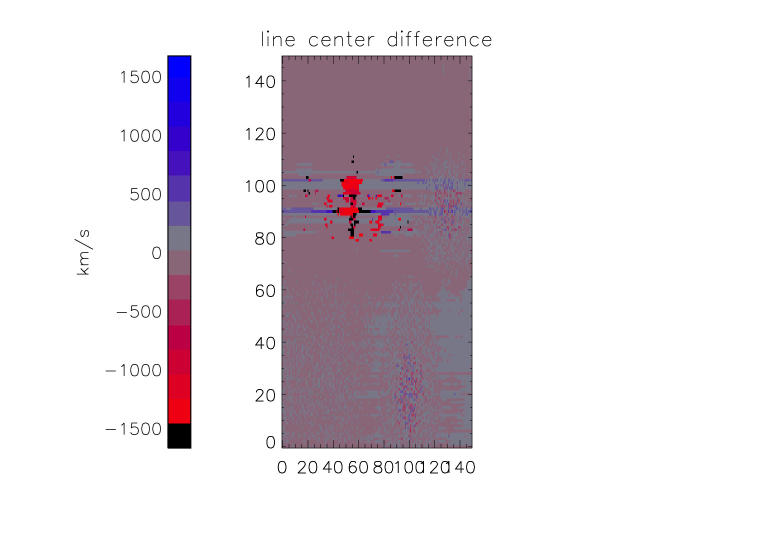
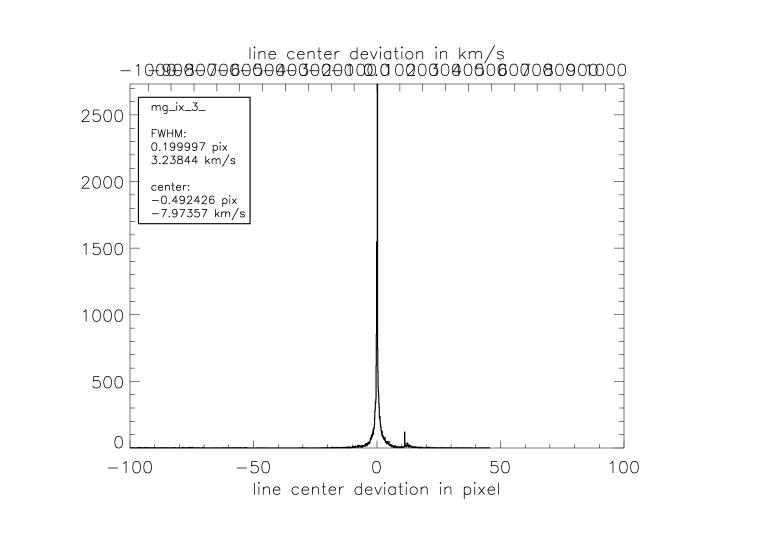
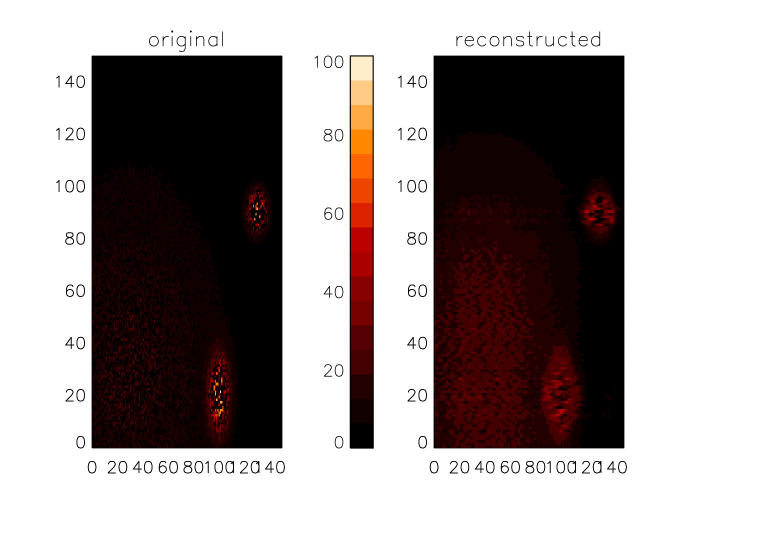
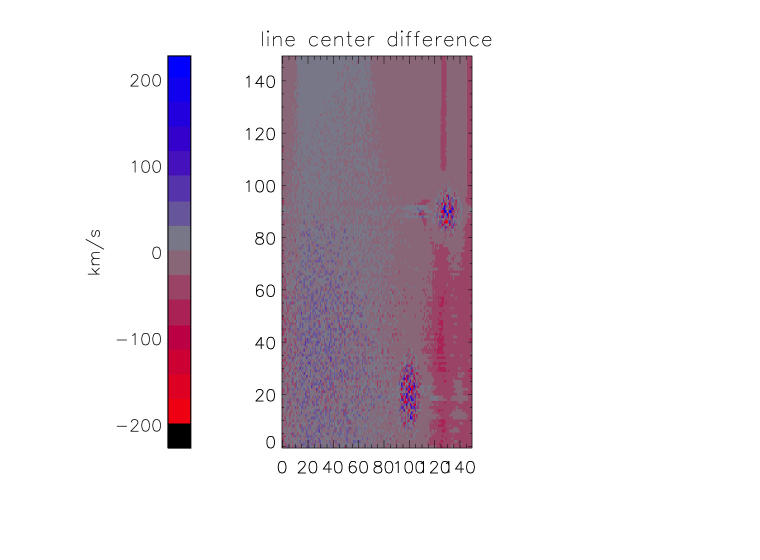
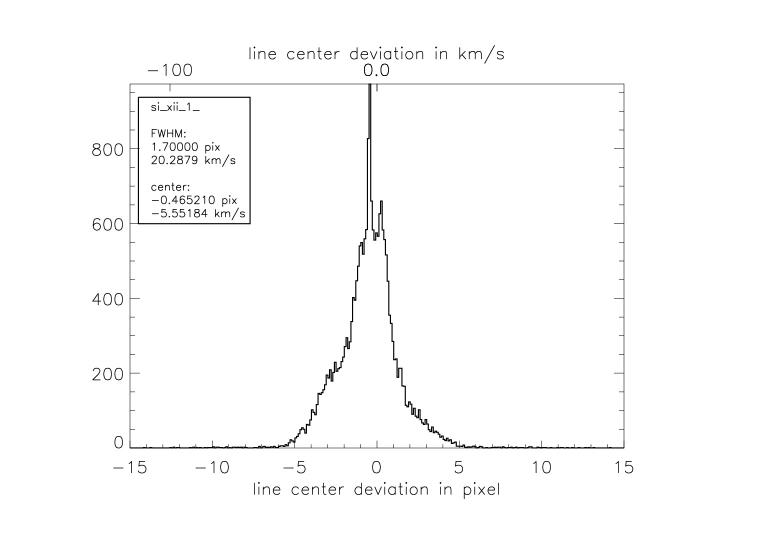
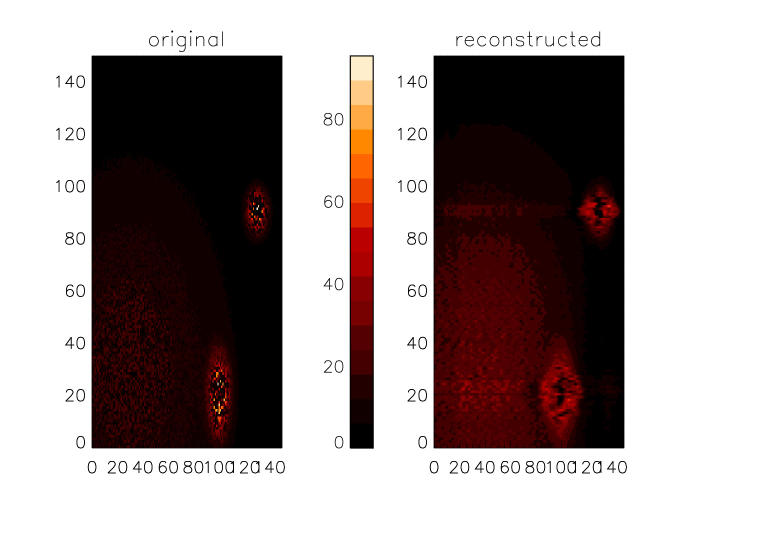
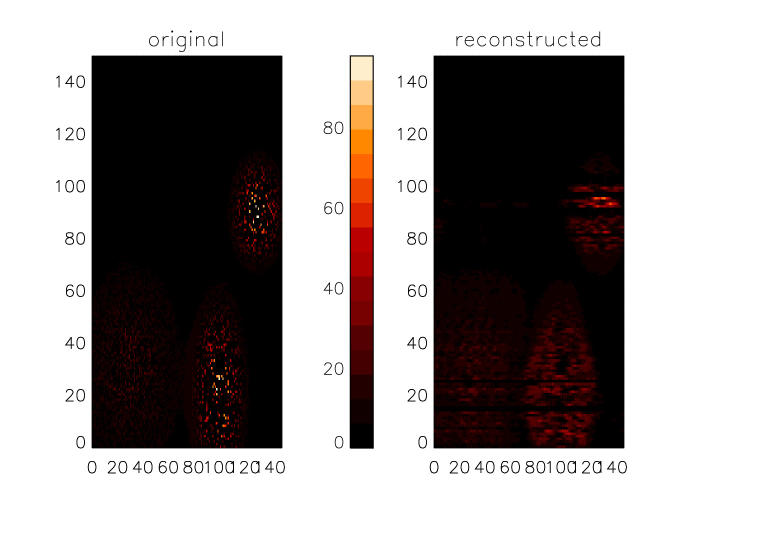
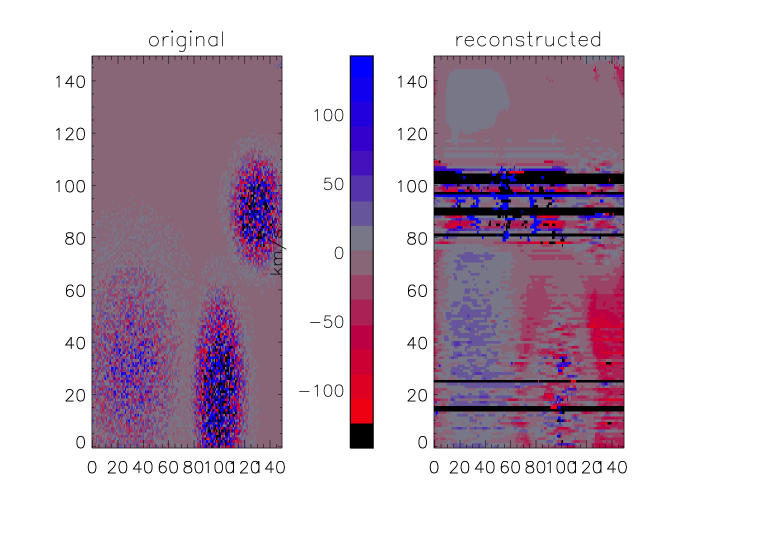
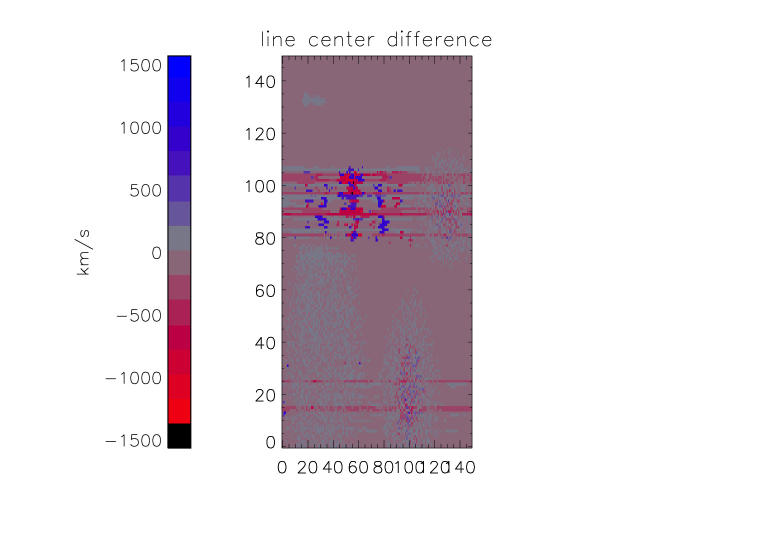
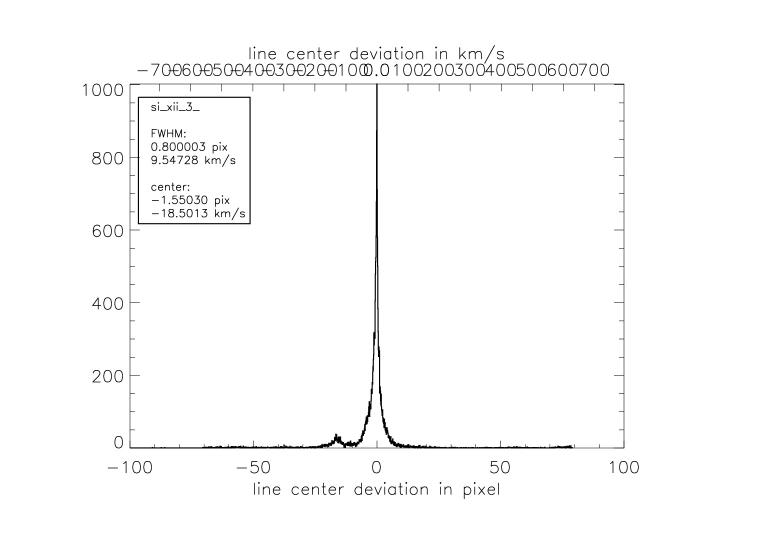
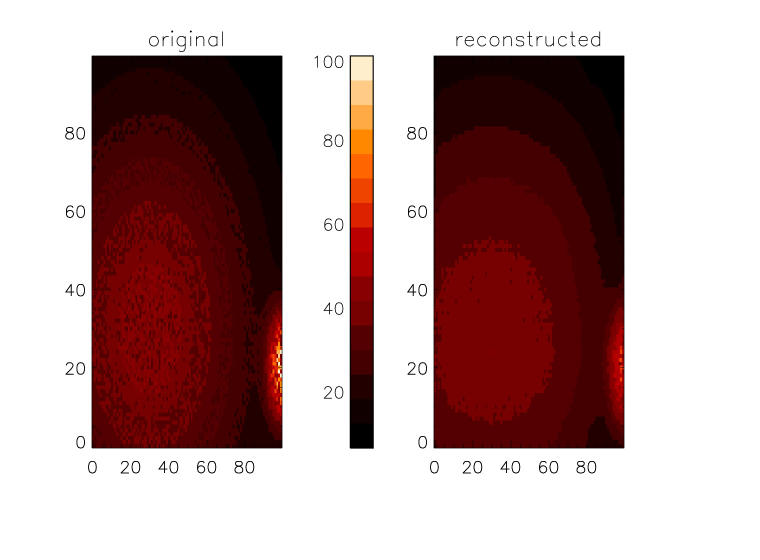
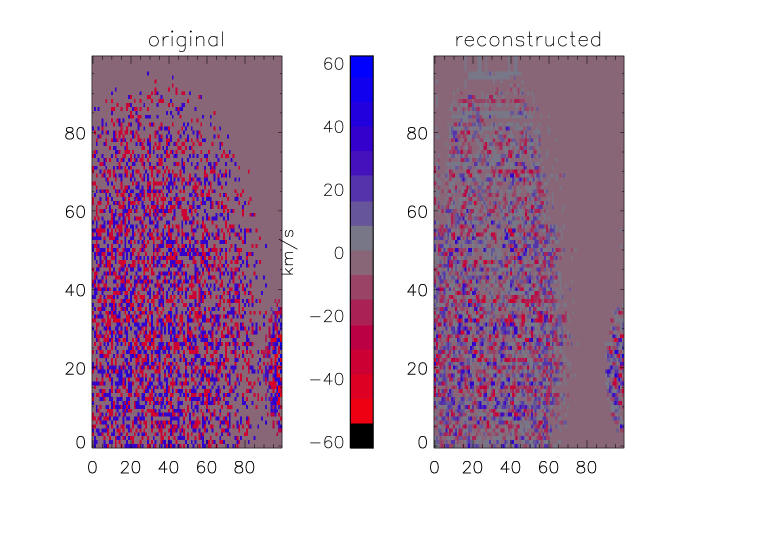
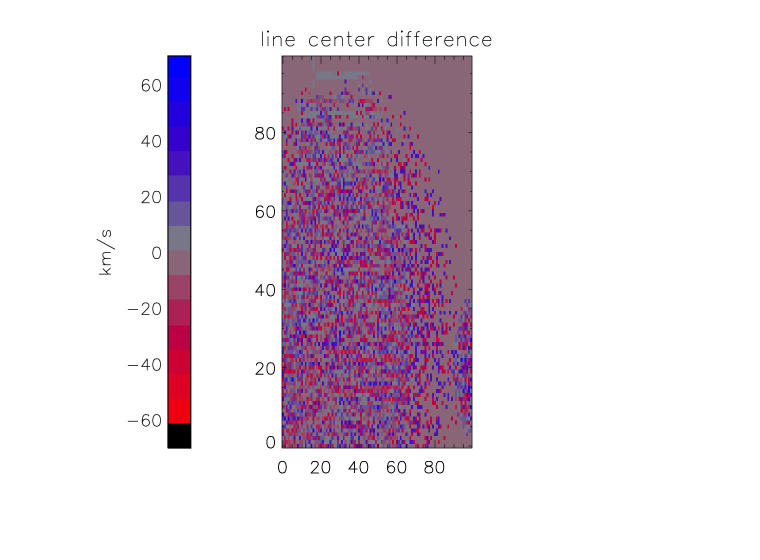
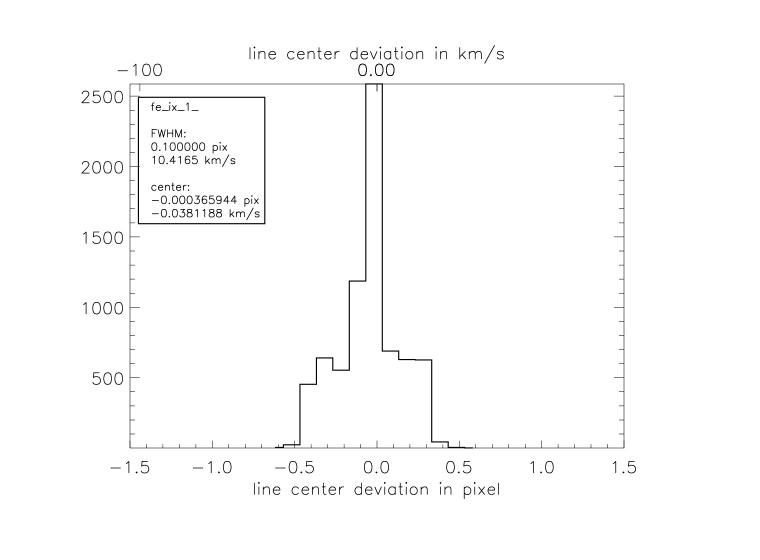
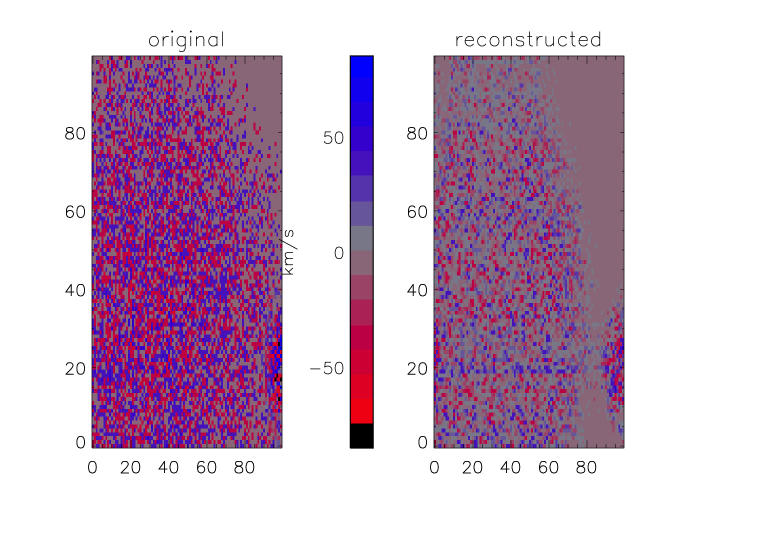
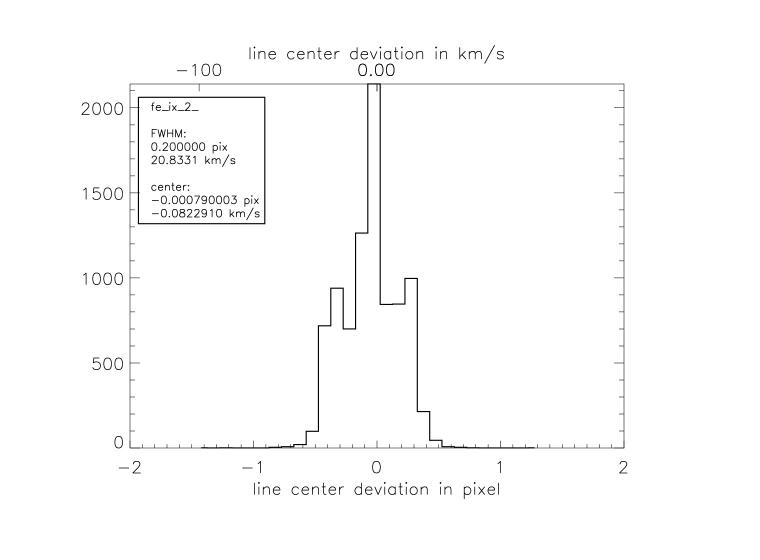
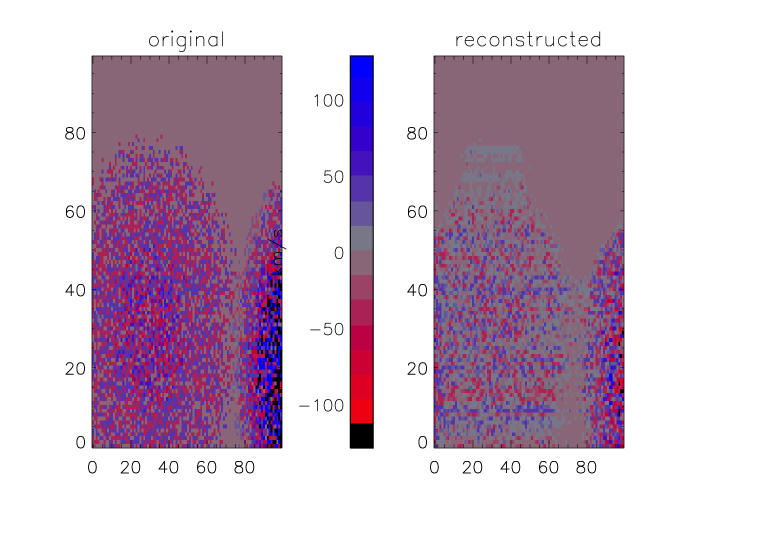
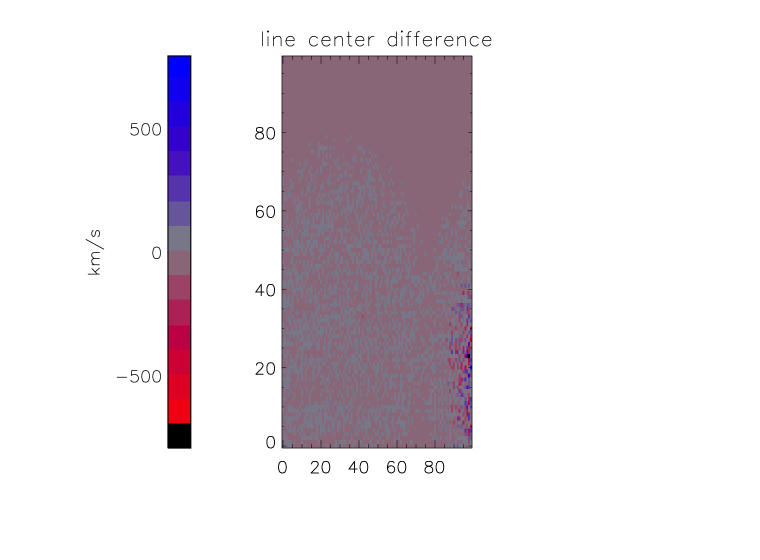
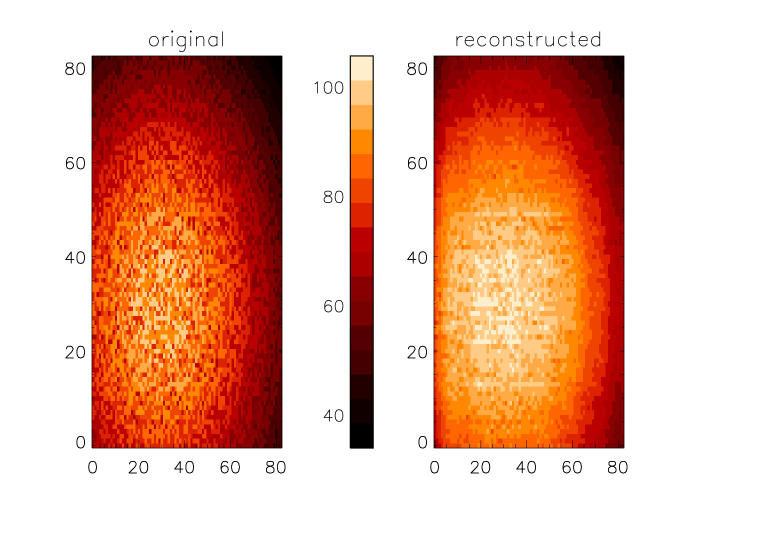
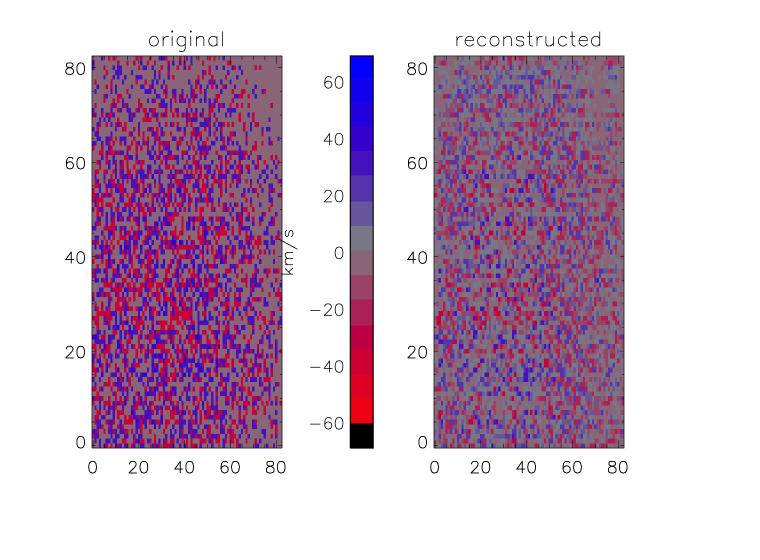
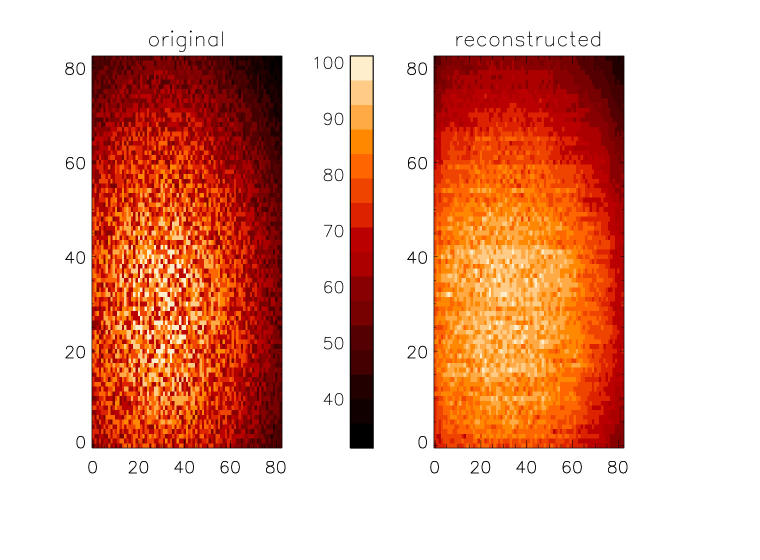
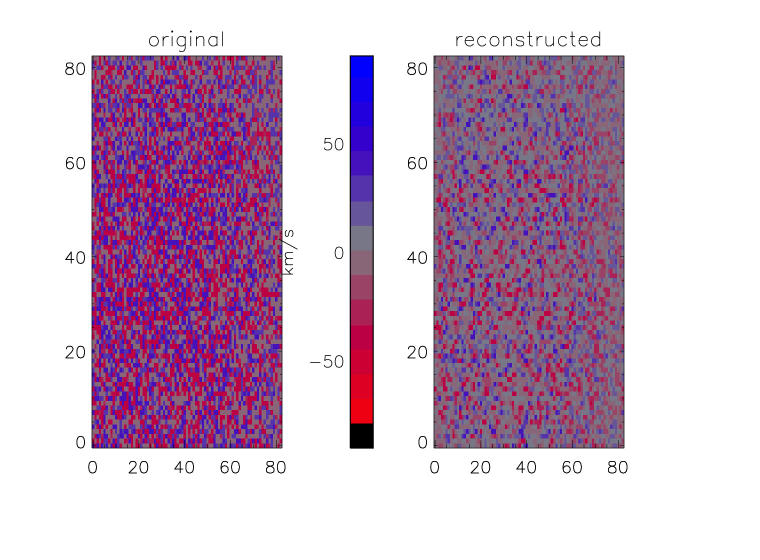
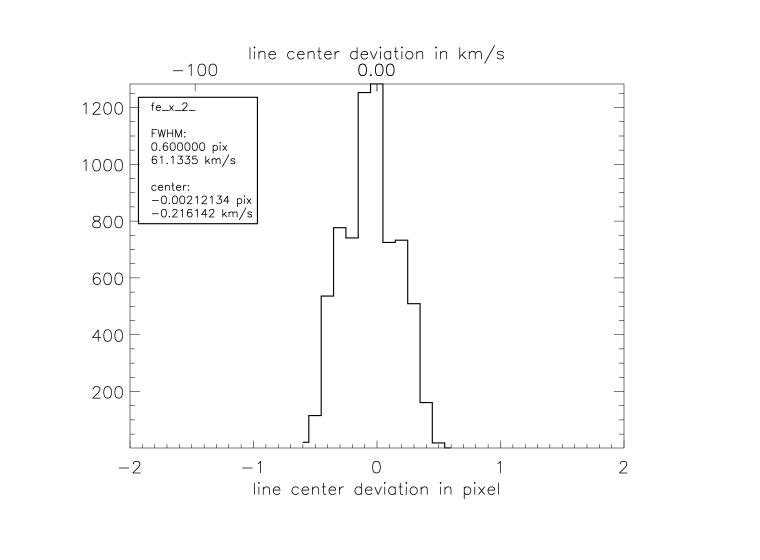
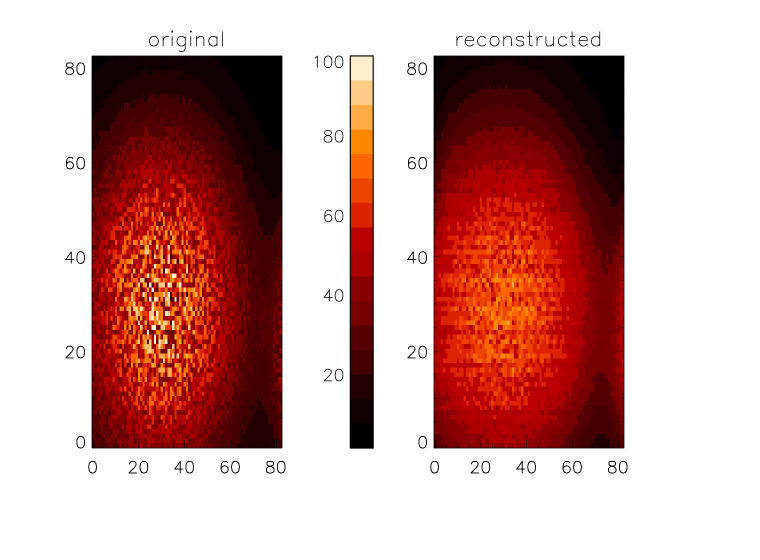
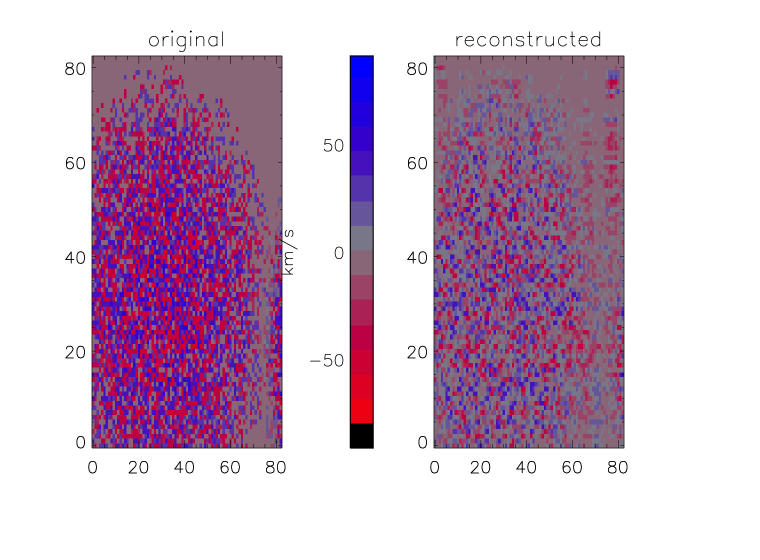
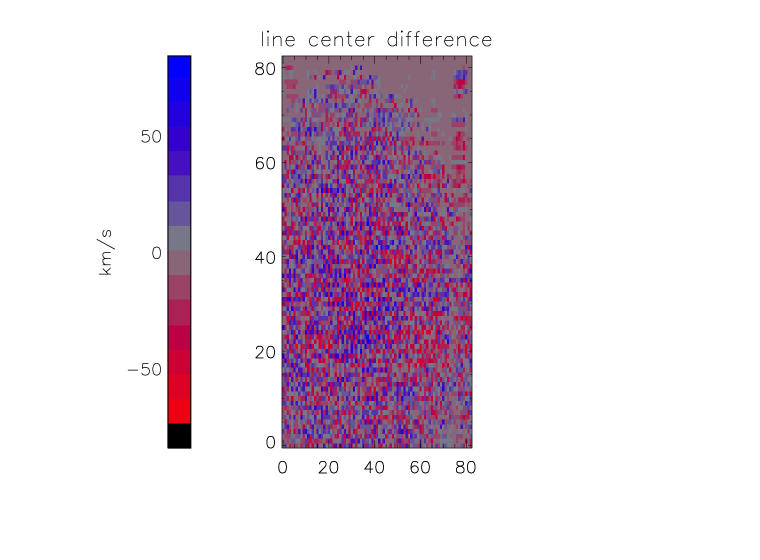
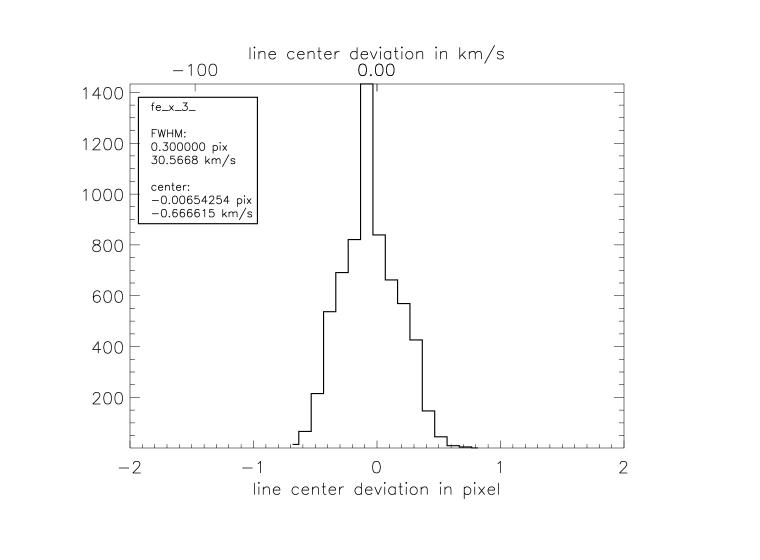
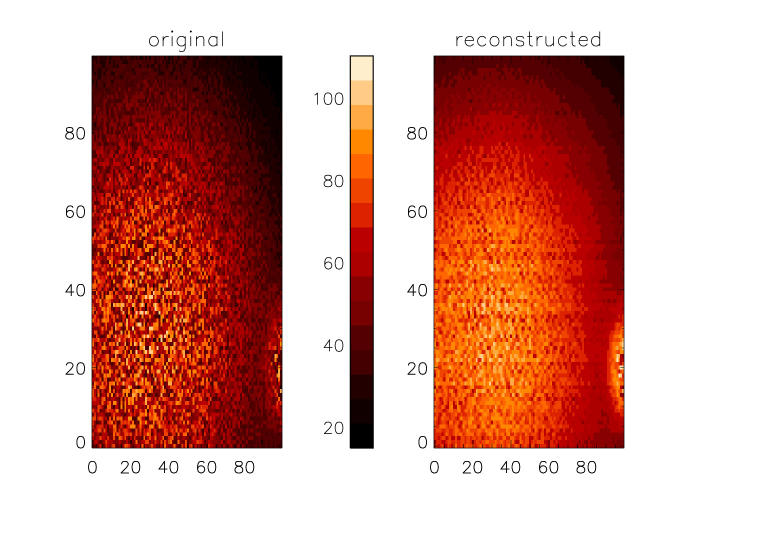
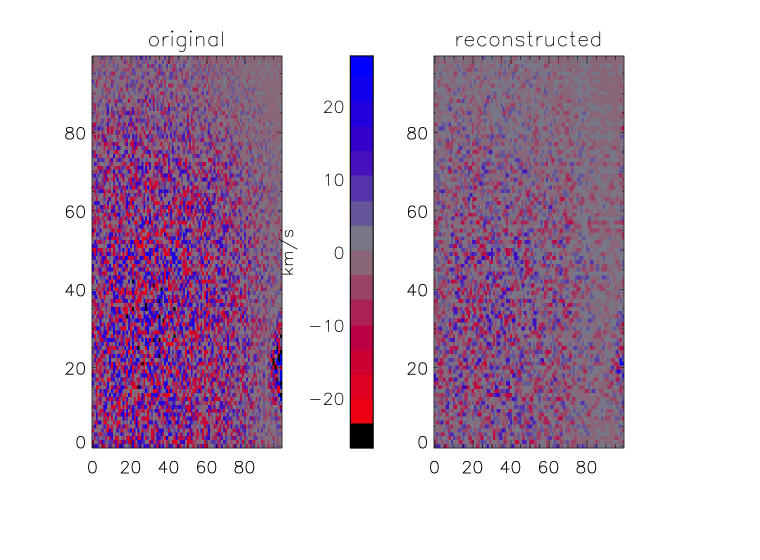
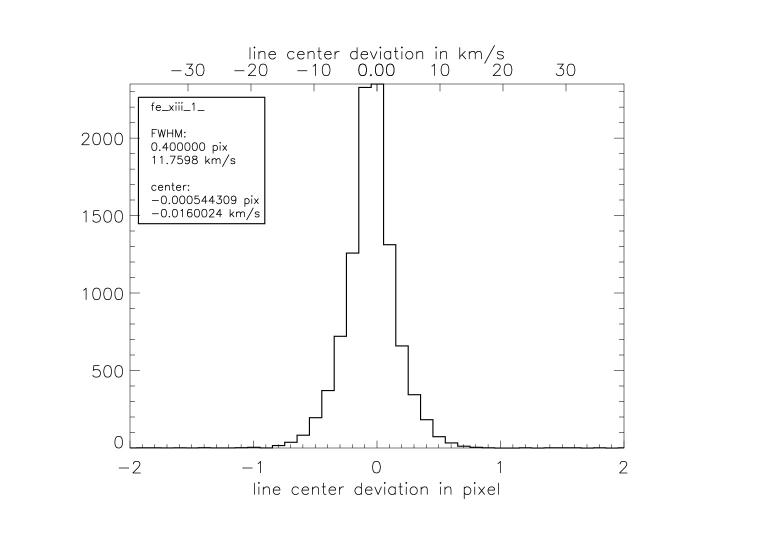
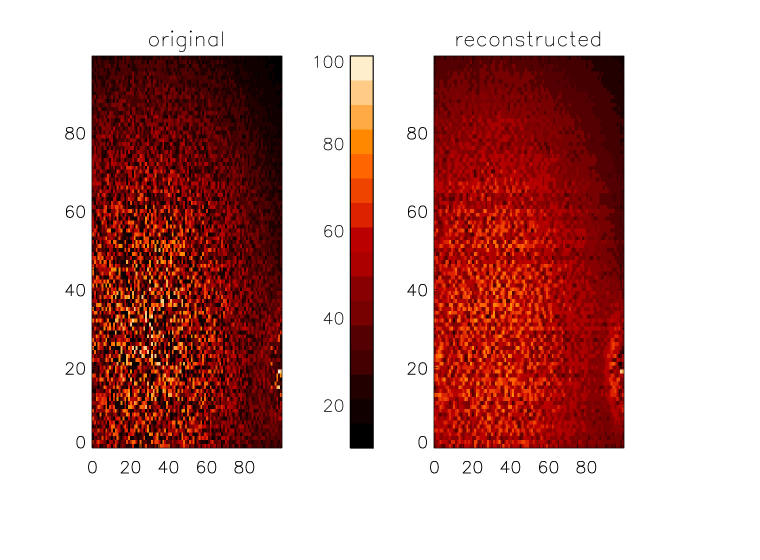
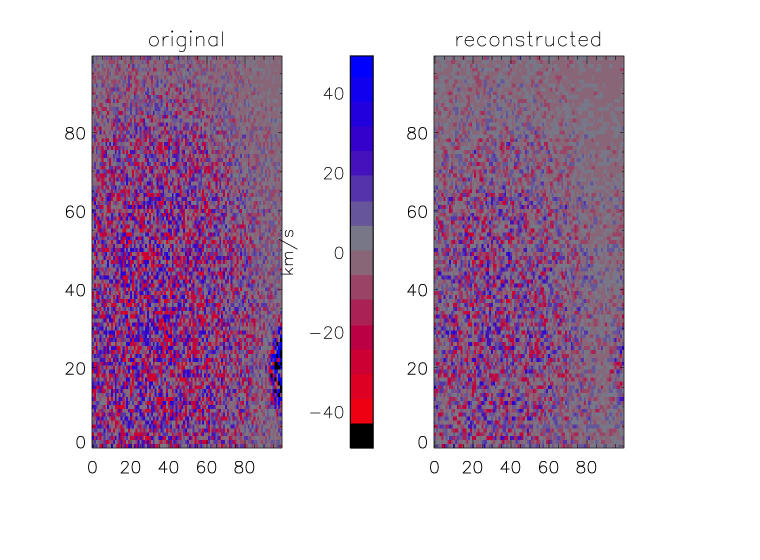
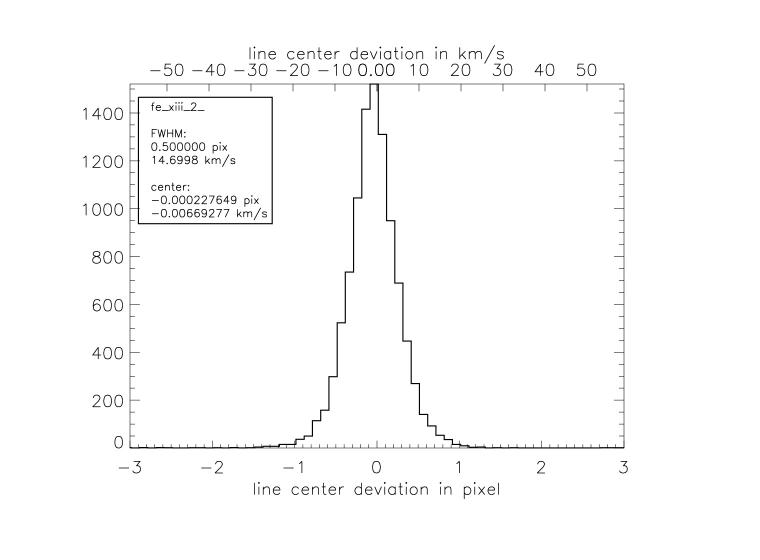
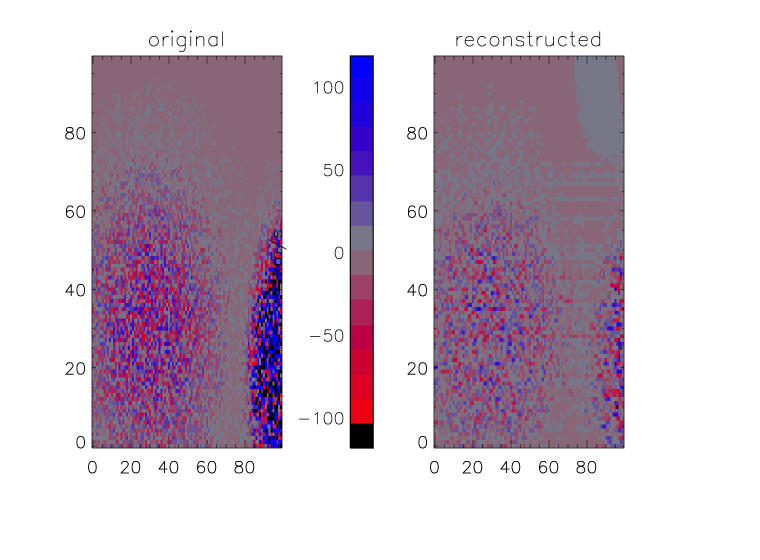
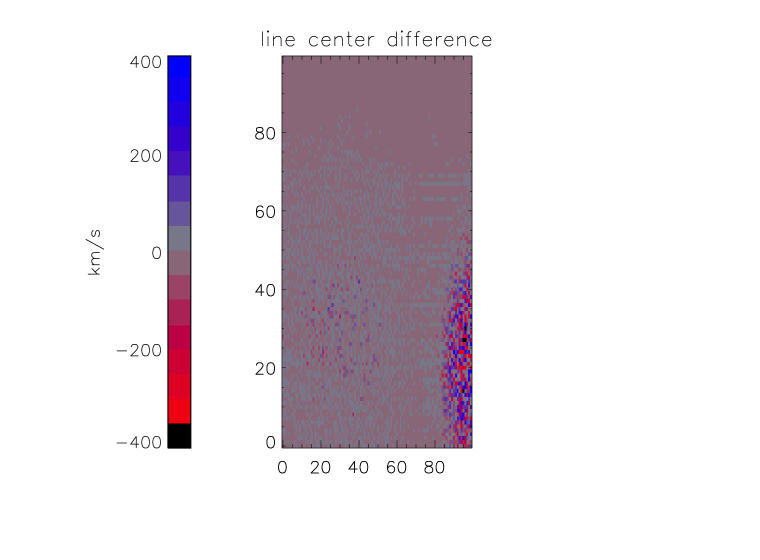
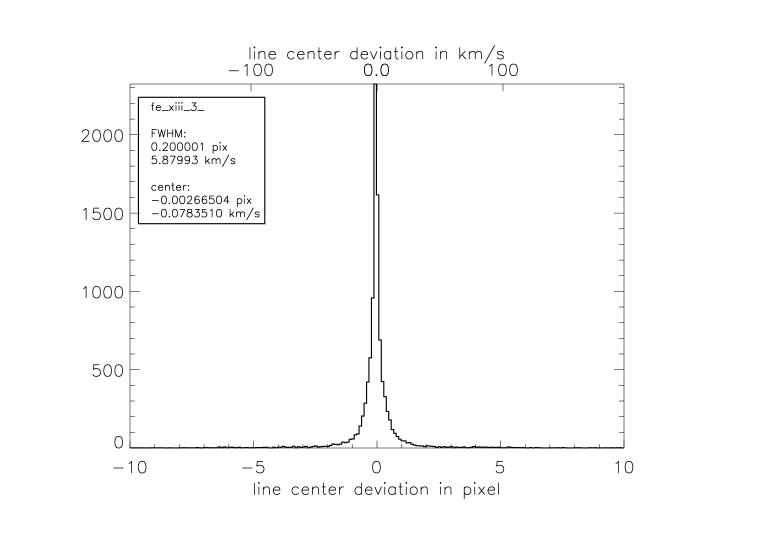
The pictures show for each line from left to right: (1) original and reconstructed images for the wavelength pixel of maximum line intensity, (2) original and reconstructed velocity map, (3) difference of the latter two, (4) values of the latter in a histogram.
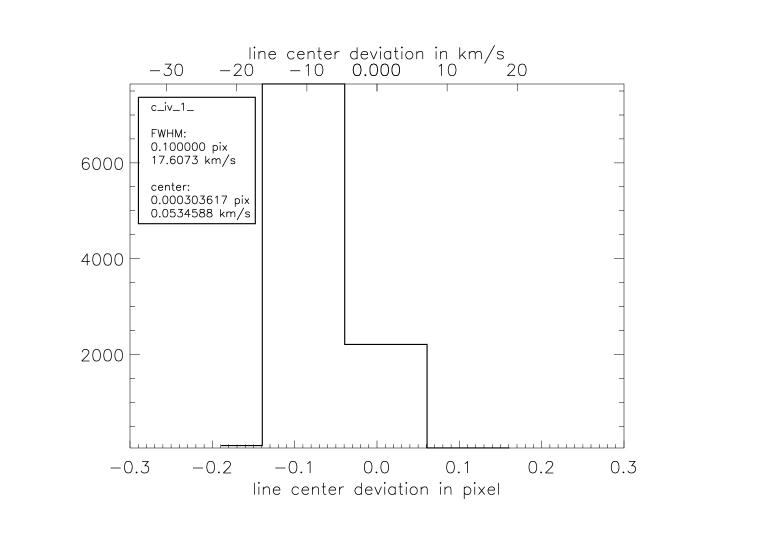
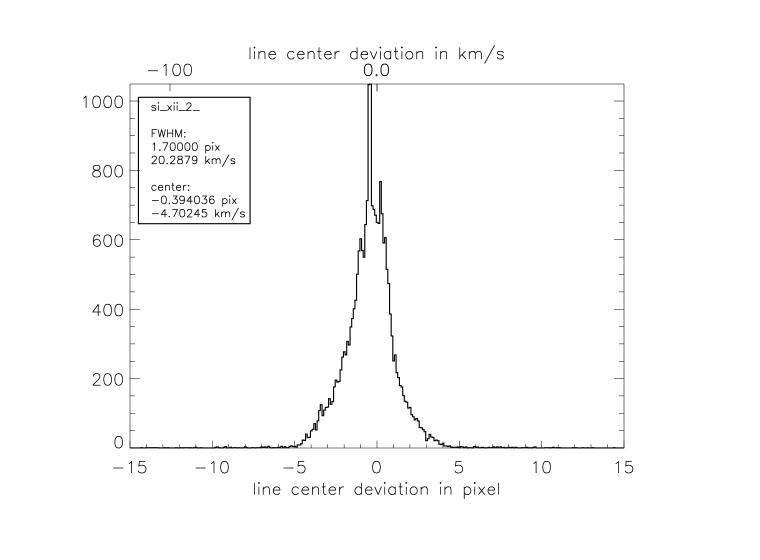
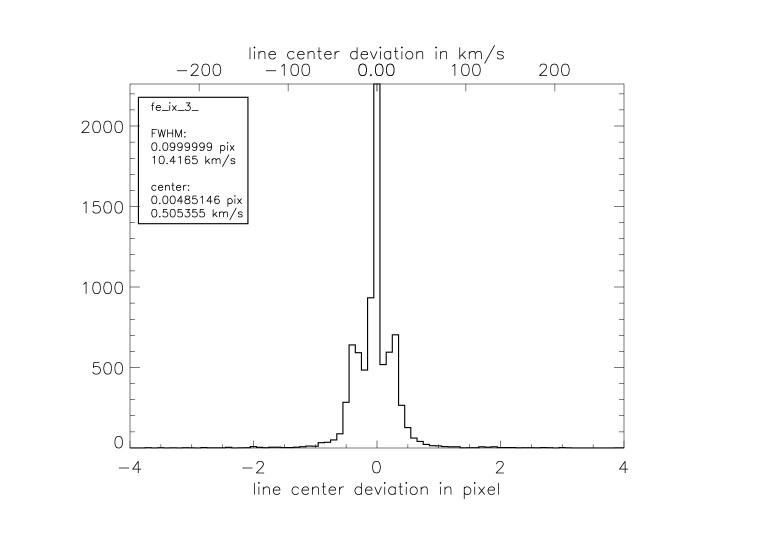
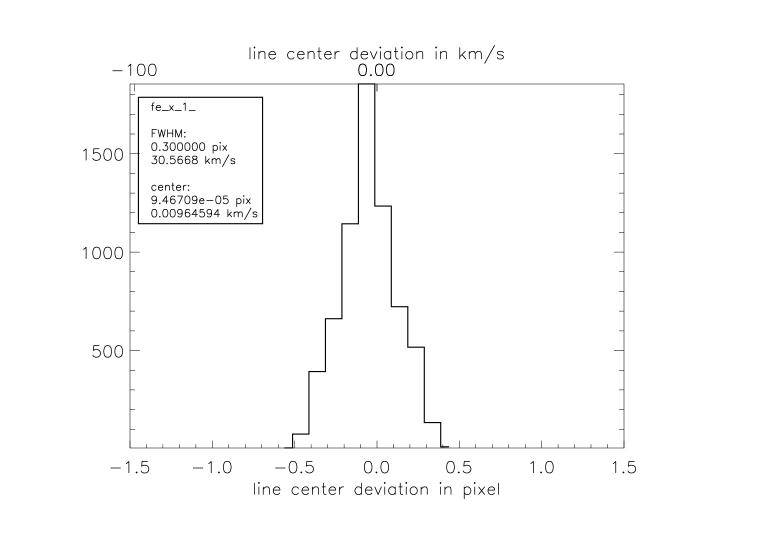
The histogram plots show the full width of half maximum (FWHM) of the distribution of errors
| C IV | |||
|---|---|---|---|
 |
 |
 |
 |
 |
 |
 |
 |
 |
 |
 |
 |
| Mg IX | |||
 |
 |
 |
 |
 |
 |
 |
 |
 |
 |
 |
 |
| Si XII | |||
 |
 |
 |
 |
 |
 |
 |
 |
 |
 |
 |
 |
| Fe IX | |||
 |
 |
 |
 |
 |
 |
 |
 |
 |
 |
 |
 |
| Fe X | |||
 |
 |
 |
 |
 |
 |
 |
 |
 |
 |
 |
 |
| Fe XIII | |||
 |
 |
 |
 |
 |
 |
 |
 |
 |
 |
 |
 |
Introduction to Multi-Order Imaging
Wavelength Selection for Solar Orbiter EUI
Detailed Theoretical Information