XMM Users'
Handbook


Next: Non-dispersive spectroscopy: an example
Up: A comparison of XMM
Previous: A comparison of XMM
Effective area for dispersive spectroscopy
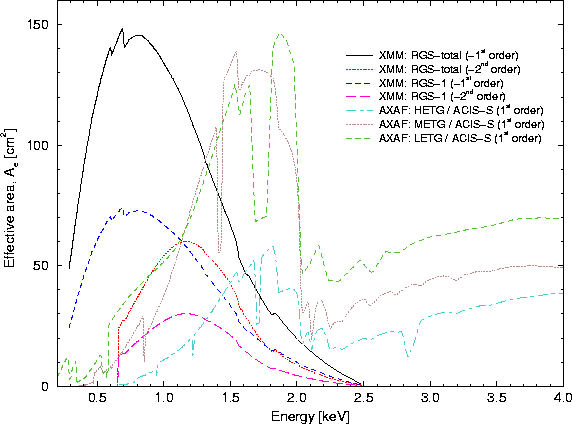
Fig. 74 displays the effective area of both RGS units together (from Fig. 54), compared with different
AXAF instrument combinations. In order to avoid overcrowding the figure,
the combination of AXAF HRC+LETG is not shown.
Figure 74:
The effective area of both RGS units combined and RGS-1
(linear scale), compared with AXAF's ACIS-S instrument with various
transmission gratings.
 |
European Space Agency - XMM Science Operations Centre

