The coincidence area determination in the Grisms
Early work on the MIC detectors at UCL (Fordham et al.) showed that the coincidence loss could be corrected for flat illumination by computing the observed rate over a certain area, which we will call here the coincidence area, or in short coi-area. They further showed that the same approach can be used to correct for point sources. They report that the coi-area can be dependent on the detector.
The UVOT has redundancy in its filter wheel and detector assemby. Since lauch one unit has been used and calibrated, which is known as ‘uvota’. For point sources the coincidence loss correction is performed using a circular area of 10 pixels centered on the source. Poole et al. have shown that for this size of the coi-area the photometry was least affected (i.e., had the smallest error) by coincidence loss. It should be mentioned that the choice of the coi-area is also relevant to the detemination of the instrumental zero points of the photometry, as a larger coi-area would include a larger part of the source photons which are falling off according to the point spread function. In Breeveld et al. it was shown that this also gives a good correction for the background, unless the background is exceptionally high, in which case a slightly larger coi-area works well.
In spectra the detector illumination extends over many pixels, far more than the three used in the centroiding of events. This will tend to increase the coincidence loss. The physical reasoning behind this is that the centroiding of a photon splash in a frame will pick the highest peak. Statistical noise, and the linear spectrum in the grism images implies that in some frames neighbouring pixels will have more chance to cause coincidence loss than would happen in a point source. Based on this simple picture we would expect a larger coincidence loss area for grism spectra than for a point source.
Some new questions arise that were no concern for a point source. One question is how far the effects of coincidence loss reach along and across the spectrum? Another question is coincidence loss in a bright emission line which is seen to affect the spectrum over some distance. That distance may be an indication of the extent of the coincidence loss area along the spectrum.
Figure 1

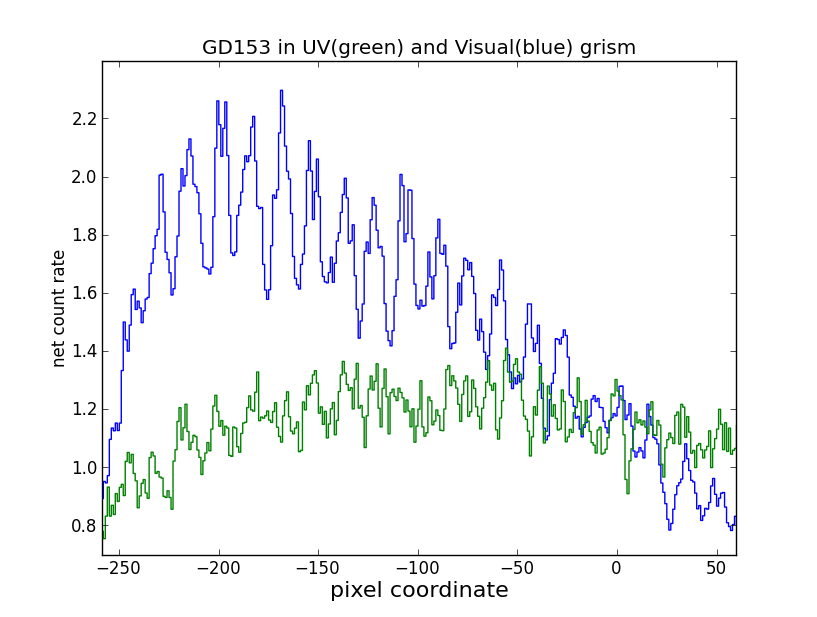
This figure shows the effect of coincidence loss on a very bright smooth input spectrum. The blue spectrum shows the DA White Dwarf GD153 in the visible grism, the green spectrum in the uv grism. The net count rates are shown where the background has been removed.
When we consider the spectra of a series of sources with increasing brightness, it becomes clear that spectra exceeding a certain brightness level show instrumental peaks and vales. It is thought that the high brightness affects the on-board centroiding which has been fine tuned for a smoother brightness variation. The photons at high coincidence loss are mis-registered and appear as bright points in a modulo-8 pattern in the grism image. As the spectrum lies at an angle over the pixel grid, the brightness distribution of the extracted spectrum of a very bright source shows this variation, even when the source spectrum is smooth. This effect is most prominent at the bright part of the spectrum where the grism effective area peaks. For example, spectra taken from GD153, a DA white dwarf star, see figure Figure 1 for this. That spectrum is quite typical for the variations in spatial frequency. The pattern is more pronounced in the visible grism since it is more sensitive than the uv grism.
For the determination of the coincidence loss, we need to average over this pattern. Bright spectral lines show that the coincidence loss is quite extended. After some trials, we decided to use a length \(L_{coi}\) along the spectrum determined approximately from 24 subpixels divided by the cosine of the typical angle of the spectrum on the detector for each of the grism modes. This averages the count rate over most of the variations.
Table: Coincidence loss area box; length, width, and multiplier
| Grism mode | \(L_{coi}\) pixels | \(W_{coi}\) pixels | coi-multiplier \(m_{coi}\) |
|---|---|---|---|
| uv nominal | 27 | 15 | \(1.12 \pm 0.05\) |
| uv clocked | 29 | 15 | \(1.11 \pm 0.05\) |
| visible nominal | 28 | 14 | \(1.13 \pm 0.03\) |
| visible clocked | 31 | 13 | \(1.09 \pm 0.03\) |
The coincidence area \(A_{coi}\) is most simply represented by a box of length \(L_{coi}\) and width \(W_{coi}\), multiplied with a correction factor \(m_{coi}\), named coi-multiplier,
The measured count rate for the coincidence loss correction is thus determined for that area, and the corresponding background is computed for an equivalently sized area.
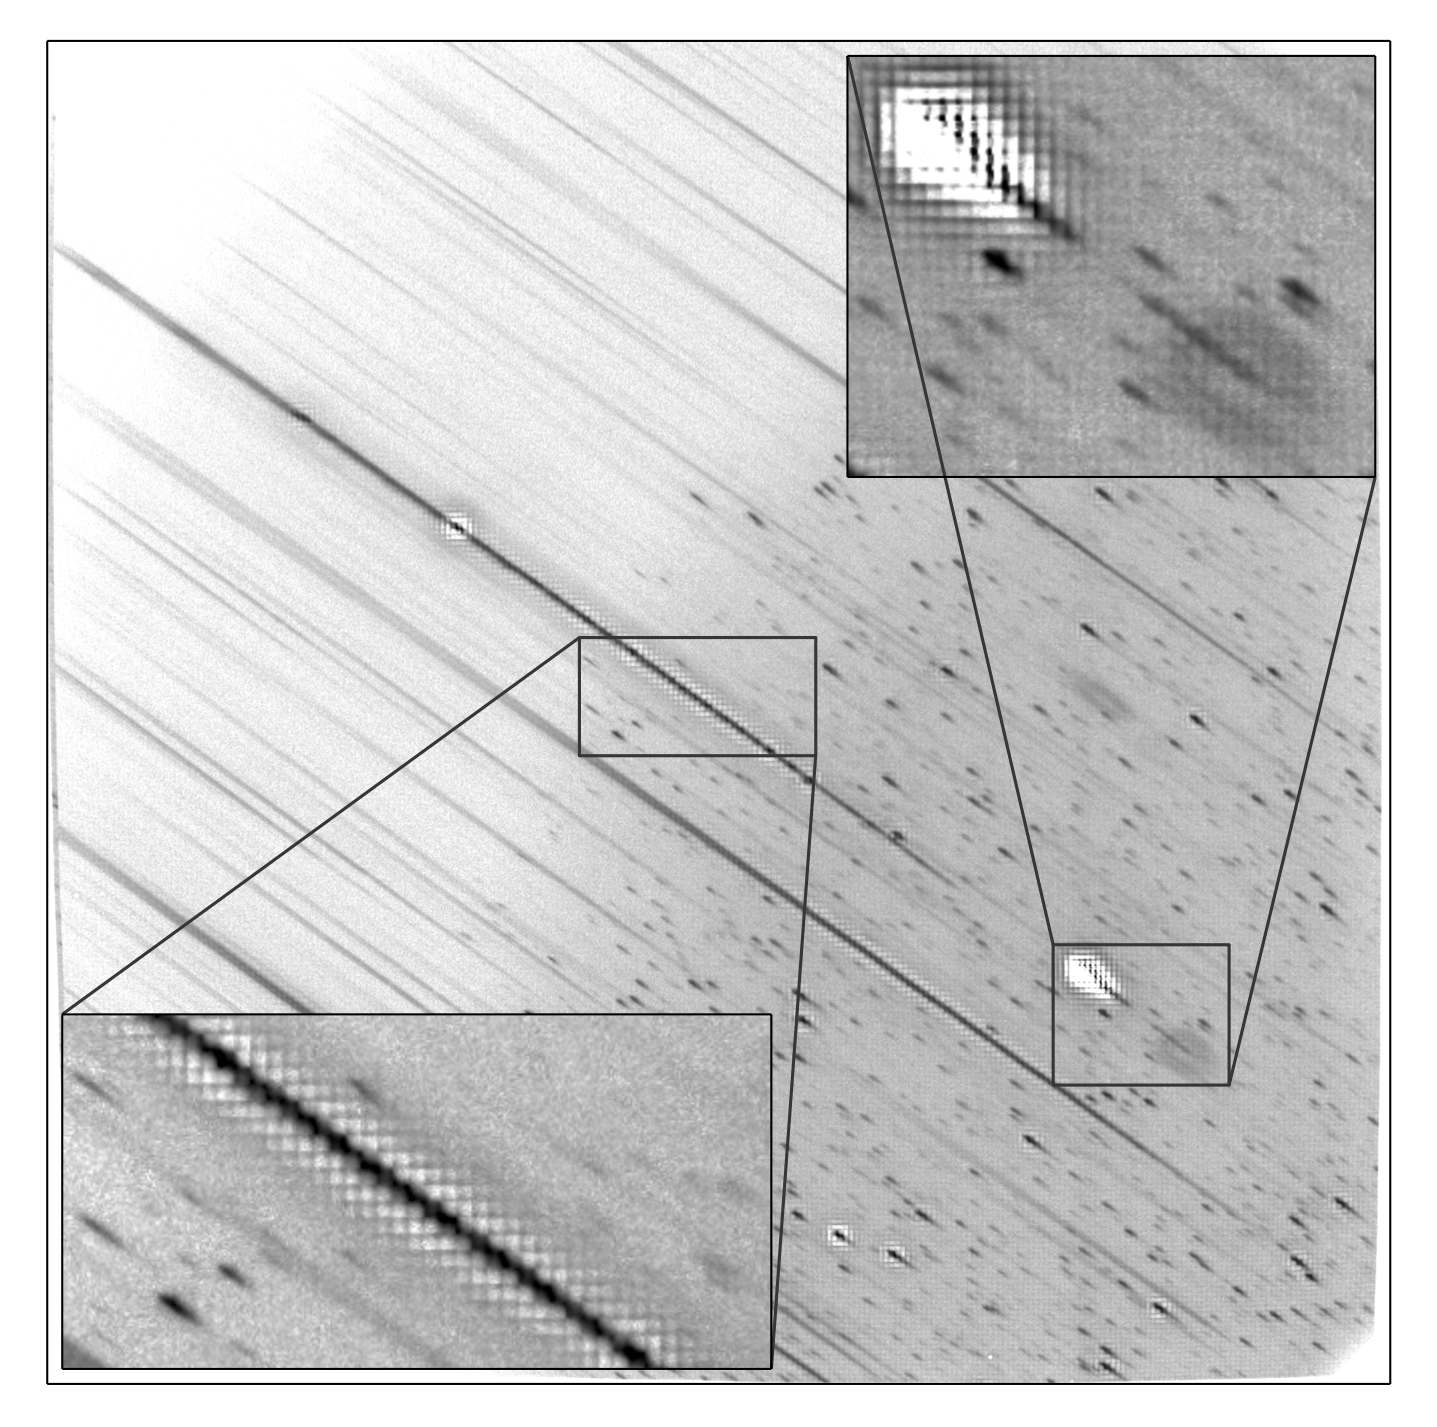
Finally, a view of a bright spectrum on the detector.
Figure 2

The bottom inset enlarges a part of the first order spectrum of a bright source. Although not as bright as GD153, the modulo-8 pattern is clearly seen. The pattern around the bright emission lines show the extent of the coincidence loss of bright features along the spectrum.
This spectrum is on the upper brightness ranges of where the coincidence loss can be corrected for.
The coi-area is then used in correcting for Coincidence loss in the UVOT.


